- Climate
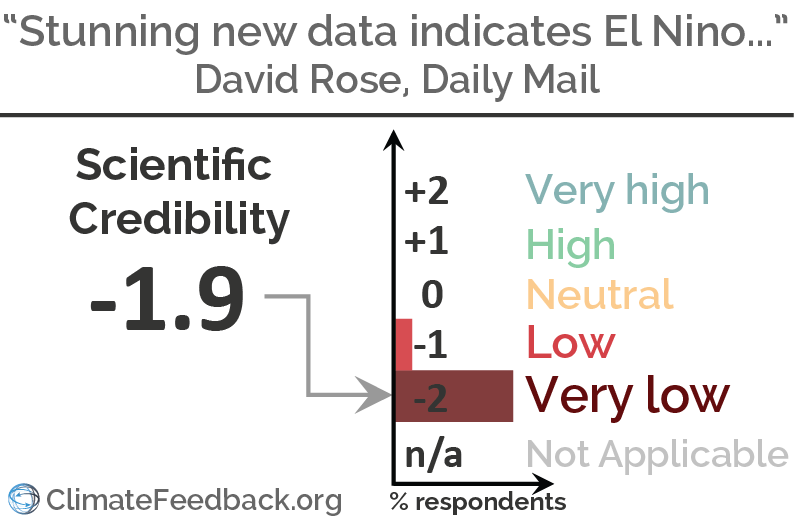
Analysis of "Stunning new data indicates El Nino drove record highs in global temperatures…"
Reviewed content

Published in Daily Mail, by Judith Curry, David Rose, on 2016-11-26.
Scientists’ Feedback
SUMMARY
Contrary to what this article implies, the long term global temperature rise is known to be mostly due to human emissions of greenhouse gases. A strong El Niño event helped set a new record in annual global surface temperature in 2015 (and likely again in 2016) by boosting global temperatures on top of the long-term warming trend.
This article is a textbook case of cherry picking—it selects only one record, ignores the limitations of the data it comments on, and forms an argument based on only a few months of a much longer record. This is akin to claiming that sea level rise has ended because high tide in one area has ebbed.
See all the scientists’ annotations in context
The article has been originally published by The Mail on Sunday and then published online on the Daily Mail‘s website.
GUEST COMMENTS

Climate Research Lead, Stripe
This is an incredibly misleading article. It cherry picks a dataset taking measurements 2 miles up in the atmosphere only over land areas that disagrees with the other two datasets that examine the same values. The author of the dataset they use specifically warns against using it due to errors in measurement times. Literally all other surface and satellite datasets show no corresponding massive decline, either over land or globally. The author is taking a normal modest cooling at the end of a large El Niño event and spinning it completely out of proportion.
In reality, 2014, 2015, and 2016 have been the three warmest years on record not just because of a large El Niño, but primarily because of a long-term warming trend driven by human emissions of greenhouse gases. The modest decline in temperatures in recent months from the peak of the El Niño event is completely in line with what has happened during past large El Niño events and was expected by scientists.

Professor, University of Bristol
This article is flawed to perfection. Mr. Rose made the following inadvisable choices:
1. Ignore the surface temperature record and use only satellite data. Satellites do not measure temperature, they measure microwave radiation, which can be related to an estimate of temperature by use of a computer model. The resulting estimate is, however, not only of temperature at the surface of the Earth—which is where we live—but includes temperature at altitudes of thousands of feet—where no one is trying to farm or grow tomatoes.
2. Ignore two-thirds of the satellite record. Most of the Earth is covered in ocean, and global warming is called global warming because it is global—that is, it includes the oceans.
3. Ignore the trend and focus on two data points. A long-standing trick of people who deny the overwhelming scientific consensus regarding climate change is to cherry-pick isolated observations. The only way to support the claim of a 1-degree drop in the satellite record is by comparing February 2016 to October 2016. This drop, however, is merely weather that is superimposed on the long-term climatic trend.

Professor, University of New South Wales
The discussion in the article of a disagreement among scientists as to whether the record-breaking global heat in 2015 and again in 2016 was “due to El Niño” vs. “due to global warming” is completely bogus. Both global warming and El Niño, added together, produced these records. El Niño by itself could never have produced such a warm planet as we have now. Everyone, including NASA’s Gavin Schmidt, has been pointing out for some time that temperatures would dip for a while once the El Niño faded, but that’s just a bump on the road to a warmer and warmer planet.
REVIEWERS’ OVERALL FEEDBACK
These comments are the overall opinion of scientists on the article, they are substantiated by their knowledge in the field and by the content of the analysis in the annotations on the article.

Principal Research Fellow, National Centre for Atmospheric Science
Overall the article is made highly misleading by omitting critical information and cherry-picking one particular dataset and time period. It also incorrectly interprets comments from climate scientists.

Professor, Earth Observatory of Singapore
The claim that global land temperatures have plunged by a record margin is false because: (1) the author cherry picks the data, relying on the satellite record of Earth’s temperature, which only dates to 1978 rather than the surface temperature record which dates to the 19th century. Using the full dataset the decrease in land-based temperature is NOT a record drop; (2) the author IGNORES THE OCEANS. When combining both the land and ocean, there is not a record fall in the satellite record; and (3) the surface temperature record shows an unmistakably upward trend, irrespective of year-to-year wiggles.

Scientist, University of Bonn, Germany
It is a pity the rating scale does not allow for rating below “very low”. Had the article honestly shown a graph of the global surface temperature increase in the last century every reader would have seen how deceptive David Rose’s article is.

Assistant Professor, University of Washington
It is well known that global temperature falls after receiving a temporary boost from El Niño. The author cherry-picks the slight cooling at the end of the current El Niño to suggest that the long-term global warming trend has ended. It has not.
Notes:
[1] See the rating guidelines used for article evaluations.
[2] Each evaluation is independent. Scientists’ comments are all published at the same time.
Key Take-aways
The statements quoted below are from David Rose; comments and replies are from the reviewers.
“Some scientists, including Dr Gavin Schmidt, head of Nasa’s climate division, have claimed that the recent highs were mainly the result of long-term global warming.”
Scientist, University of Bonn, Germany
Dr. Gavin Schmidt, who is head of NASA’s Goddard Institute for Space Studies and not any of the NASA divisions, is right. The long-term warming of about 1°C globally—and more over land or in the Northern Hemisphere—is much larger than the El Niño fluctuations.
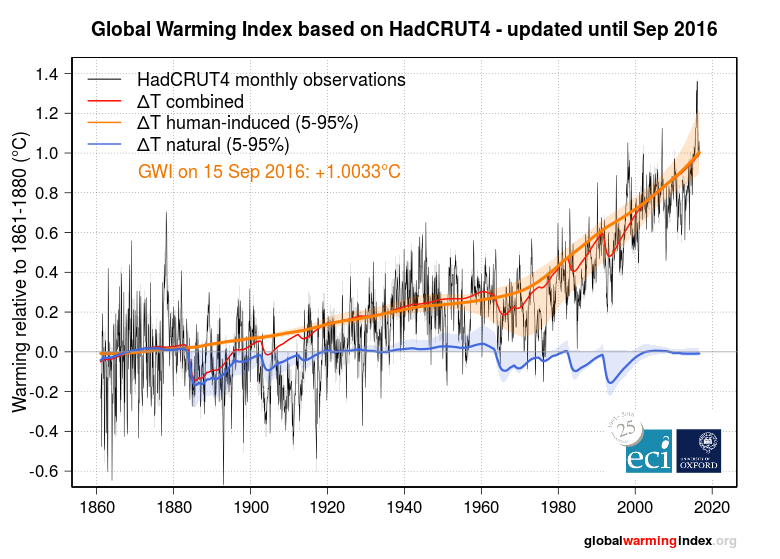
Source: Global Warming Index
“Others have argued that the records were caused by El Nino […] The new fall in temperatures suggests they were right.”
Principal Research Fellow, National Centre for Atmospheric Science
Incorrect. We have seen more than 1°C of warming which is largely due to human activities. The strong El Niño has added around 0.1°C temporarily. Therefore, the largest cause of the record temperatures is human activities.
“This means it is possible that by some yardsticks, 2016 will be declared as hot as 2015 or even slightly hotter – because El Nino did not vanish until the middle of the year.”
Scientist, University of Bonn, Germany
It is virtually certain that 2016 will be warmer than 2015. See for example this estimate of the 2016 average temperature based on the GISS data up to October.
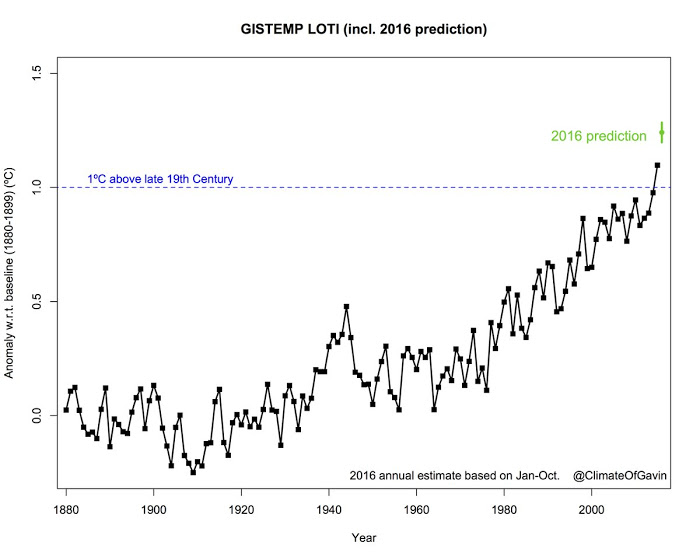
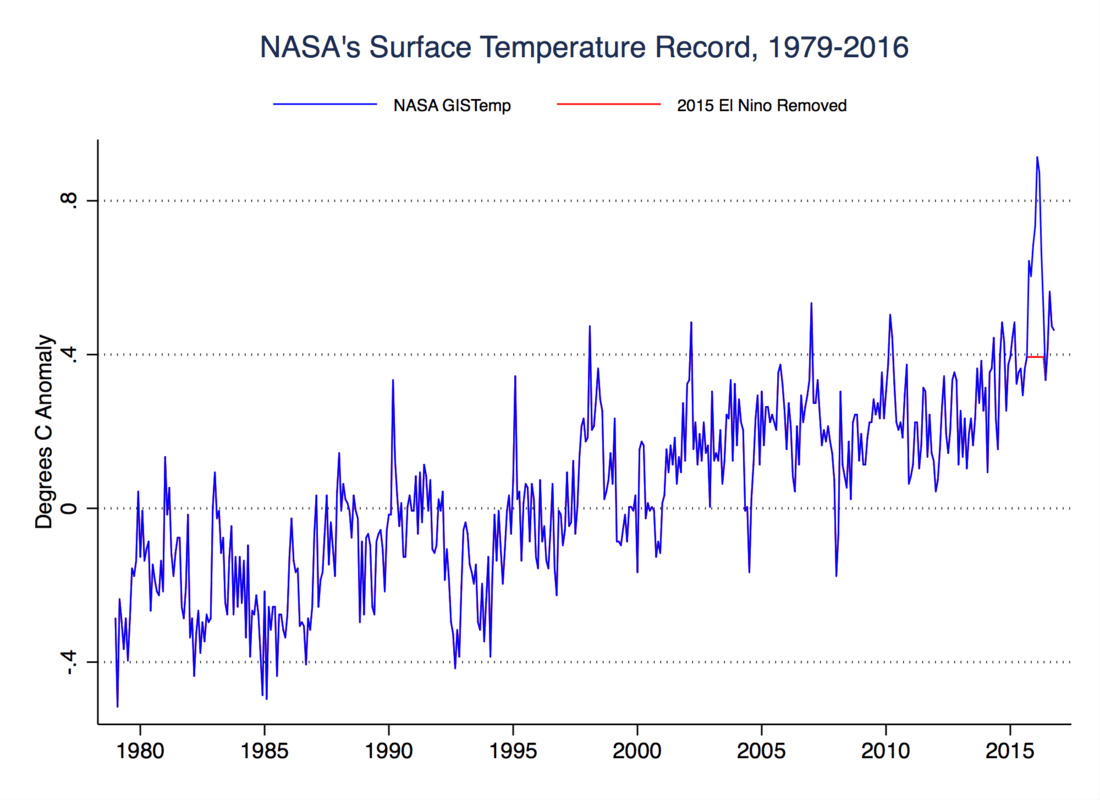
Climate Research Lead, Stripe
Even without the big El Niño spike, 2016 will be the hottest year on record, and 2015 the second hottest. Scientists have methods to remove the effect of El Niño on the temperature record. We can also see this in a simple example where we just remove the big El Niño-related temperature spike, but 2016 remains the warmest year in the surface temperature record:
“Dr. Schmidt also denied that there was any ‘pause’ or ‘hiatus’ in global warming between the 1998 and 2015 El Ninos.”
Scientist, University of Bonn, Germany
If you want to cherry pick 1998 as the beginning year—a year in which the temperature was high due to El Niño—it would at least be fair to stop in 2016, not 2015, because 2016 is the year that the temperatures were highest due to El Niño. If you do so, there is clearly no “slowdown”.
Better would be not to cherry-pick a specific period. The long-term trend is clearly warming and statistics do not indicate any decline in the warming rate. Since 2016, I would argue you no longer need statistics to see this. Just look at the complete graph.
“Professor Judith Curry, of the Georgia Institute of Technology, and president of the Climate Forecast Applications Network, said yesterday: ‘I disagree with Gavin. The record warm years of 2015 and 2016 were primarily caused by the super El Nino.’”
Assistant Professor, University of Washington
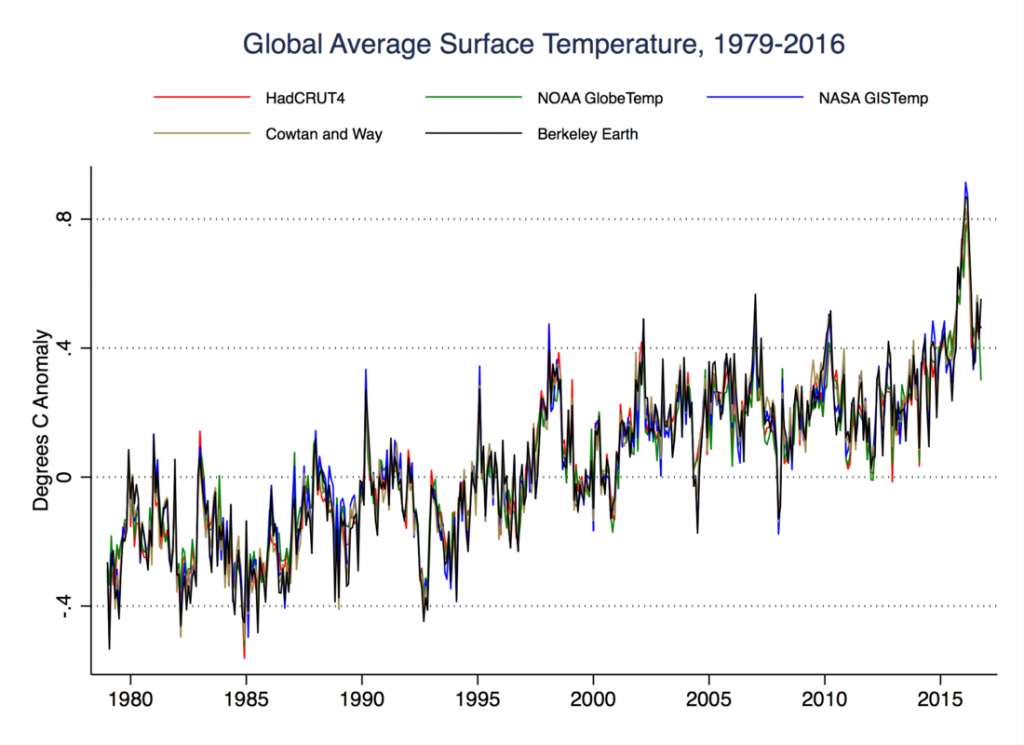
It seems kind of pointless to try to precisely attribute why one year was warmer or cooler than the last; this is basically just due to climate variability (including but not limited to El Niño). The broader point is that all evidence suggests that the long-term global surface warming trend has continued. There is no evidence that the rate of warming since 1998 is statistically different from the long-term trend since 1950.
“The news comes amid mounting evidence that the recent run of world record high temperatures is about to end.”
Climate Research Lead, Stripe
The modest decline in temperatures in the past few months is a normal reversion after the end of the El Niño event. It has relatively little impact on the longer-term warming trend, which is the most scientifically relevant metric of climate change.
Scientist, University of Bonn, Germany
We have had 3 record warm years: 2014, 2015, and likely 2016. Also when Bayern München loses a game, they are still be best team in Germany—when 2017 is not again a record year, global warming will continue.
“The fall, revealed by Nasa satellites, has been caused by the end of El Nino”
Scientist, University of Bonn, Germany
The temperature estimates come from passive microwave radiometers. These instruments’ prime task is estimating air humidity for meteorology—weather prediction. Thus most of the these instruments actually flew on NOAA satellites. It should be noted that they were not designed to be used for long-term climate monitoring.
Professor, University of New South Wales
Temperature averages from satellite-based detectors are very noisy, and tend to exaggerate swings due to El Niño compared with other data sources. I would not attach much significance to big upswings or downswings over periods of only a few months, especially when other indicators, like sea ice, are suggesting acceleration of warmth. The long-term upward trend is clear in every source of data we have.
“Global average temperatures over land have plummeted by more than 1C since the middle of this year – their biggest and steepest fall on record.”
Scientist, University of Bonn, Germany
It is known that El Niño, an oscillation in the tropical Pacific, is a cause of short-term fluctuations of the temperature and precipitation. This should not be confused with long-term warming. This is clearly illustrated by this graph below that shows the warming of El Niño years, La Niña years (the opposite of El Niño), and neutral years individually.
Scientist, University of Bonn, Germany
The image in the Daily Mail is deceptive as it only shows the part of the data (in the red box of the graph below). With all the problems of this dataset, it also shows long-term warming if you look at the full period.
Principal Research Fellow, National Centre for Atmospheric Science
The time series used in the central image is highly misleading, as it only shows some of the data available and therefore disguises the increase seen before the chosen period.
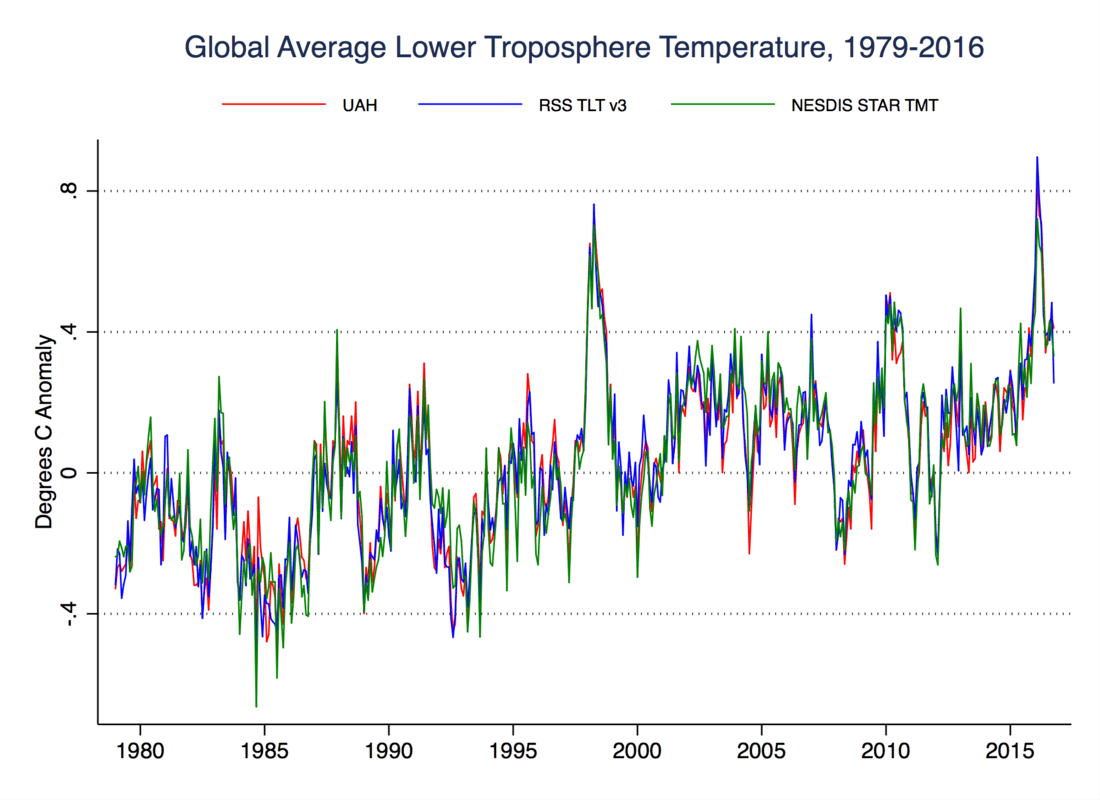
Climate Research Lead, Stripe
This is not true for global surface temperatures, not true for land surface temperatures, not true for global temperatures 2 miles up in the atmosphere, and not true for two of the three datasets that provide temperatures 2 miles up in the atmosphere only over land areas. It’s a truly breathtaking example of cherry-picking.
Furthermore, the folks who created the dataset that Rose cites (Remote Sensing Systems) note that there is a serious error in their data and warn:“The lower tropospheric (TLT) temperatures have not yet been updated at this time and remain V3.3. The V3.3 TLT data suffer from the same problems with the adjustment for drifting measurement times that led us to update the TMT dataset. V3.3 TLT data should be used with caution.”
“According to the satellites, the late 2016 temperatures are returning to the levels they were at after the 1998 El Nino.”
Scientist, University of Bonn, Germany
Not based on any evidence. Just like the warming peak due to El Niño was higher in 2016 than in 1998, the period after 2016 will be warmer than the years after 1998 due to the progress of global warming.
Climate Research Lead, Stripe
Even according to satellite records, which have their issues, this is not remotely the case: