- Climate
What’s in a number? The significance of the 1.5°C warming threshold and reporting on its breach in popular media

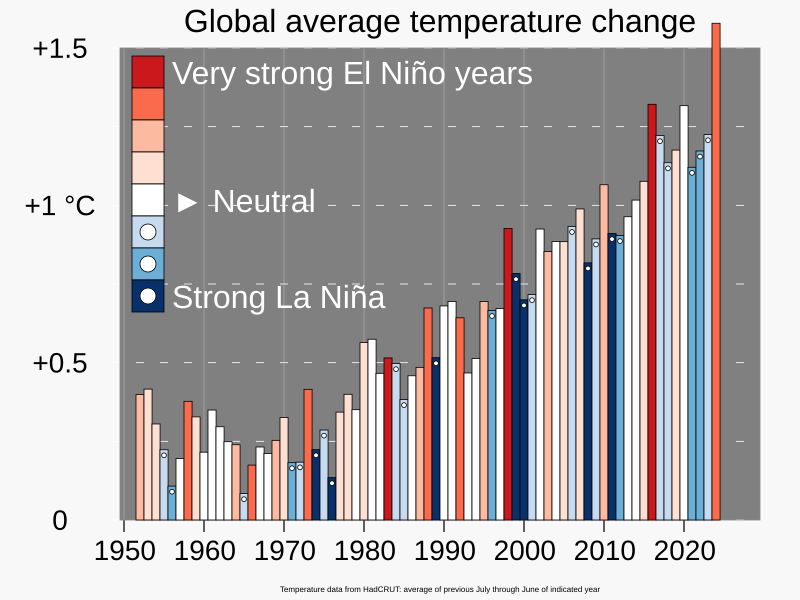
[Updated on January 10, 2025] On January 10, 2025, the European Copernicus Climate Change Service (C3S) officially declared that average global warming exceeded the 1.5°C threshold in 2024. C3S, a component of the European Union’s space program, compiles and reanalyzes global temperature data using state-of-the-art numerical models. In 2024, C3S measured a global average temperature of 15.1°C, 1.6°C higher than the average over 1850-1900, before the industrial era. This is the first time a calendar year has exceeded 1.5°C of warming, and 2024 is the hottest year on record since 1850 (see figure 1).

1.5°C is an important number in climate science. According to the Intergovernmental Panel on Climate Change (IPCC), limiting global warming to 1.5°C avoids many negative impacts on natural and human systems[1]. A warming beyond 1.5°C could trigger several climate “tipping points”, or thresholds beyond which changes in parts of the Earth system become self-perpetuating[2]. For example, passing particularly sensitive tipping points could cause the collapse of the Greenland and West Antarctic ice sheets and the die-off of tropical coral reefs. Further, the legally binding Paris Agreement tasks its global signatories (i.e. 193 countries and the European Union) to limit warming to “well below 2°C above preindustrial levels” and “pursu[e] efforts to limit the temperature increase to 1.5°C above preindustrial levels.” (see the targeted trajectories for achieving this objective in figure 2)
Crossing this threshold for the first time is important and symbolic: for journalists dealing with this information, it’s important to avoid certain pitfalls. For example, it is crucial to place this information in the context of long-term climate change, as we explain in this article. Focusing on a single year is not enough to provide information on long-term climate change.

A vast body of data shows unequivocally that ongoing global warming is due to greenhouse gas emissions from human activities[1]. Laurence Rouil, director of the Copernicus Atmosphere Monitoring Service (CAMS), states in a press release:
In 2024, atmospheric GHG reached the highest annual levels ever recorded in the atmosphere. […] Our data points clearly to a steady global increase of greenhouse gas emissions and these remain the main agent of climate change.
But be careful not to draw the wrong conclusion: “A single year above 1.5°C does not mean the world has passed that particular warming level”, said Zeke Hausfather, a climate scientist at Berkeley Earth, in a post on X in 2023. The limit set by the Paris Agreement refers to above-average temperatures averaged over at least 20 years. Climate is measured over decades, rather than years[4]. This is the main difference between weather and climate, as Science Feedback explained in a recent article.
Global temperature can vary from year to year because of oscillations inherent to the climate system. This variability is caused by naturally occurring processes such as El Niño events, which (as we explain below) can increase or decrease global temperatures for several years, independent of human activity. In fact, the World Meteorological Organization (WMO) notes that recent record temperatures can be largely explained by a mix of long-term global warming and an El Niño episode (of natural origin)[3]. While human activities are the main cause of the warming recorded in 2024, the El Niño oscillation is an additional natural factor (of weaker influence). According to C3S, the warming El Niño episode peaked in December 2023 and continued to influence global temperatures during the first half of 2024.
What is El Niño and why is it important?
The climate system is replete with naturally occurring cycles that affect global temperature, oceanic circulation, and atmospheric processes, which are commonly referred to as modes of internal climate variability[5]. The El Niño Southern Oscillation (ENSO), driven by a change in the circulation of the Pacific Ocean and a reorganization of heat exchange between surface and deep waters, is perhaps the most famous example of internal climate variability.
ENSO consists of two phases: El Niño and La Niña. The El Niño phase is characterized by elevated surface-water warming in the eastern Pacific Ocean due to an entrapment of relatively warm waters originating from South America. Because of the vast size of the Pacific Ocean, such warming also temporarily increases global surface temperature (Fig. 3). By contrast, the La Niña phase is characterized by increased heat transfer to deeper waters, and thus relative cooling in surface waters, manifesting as temporary relative global cooling (Fig. 3).
These events, along with others, can temporarily alter global surface temperature by about 0.2°C in both directions, complicating efforts to determine when a certain climate threshold is actually crossed[6]. “Due to year to year variability driven by El Niño and La Niña events, we’d expect to see single years above 1.5°C up to a decade before long-term human-driven warming passes that level”, continued Hausfather.
Our best guess on breaching 1.5°C and what that means
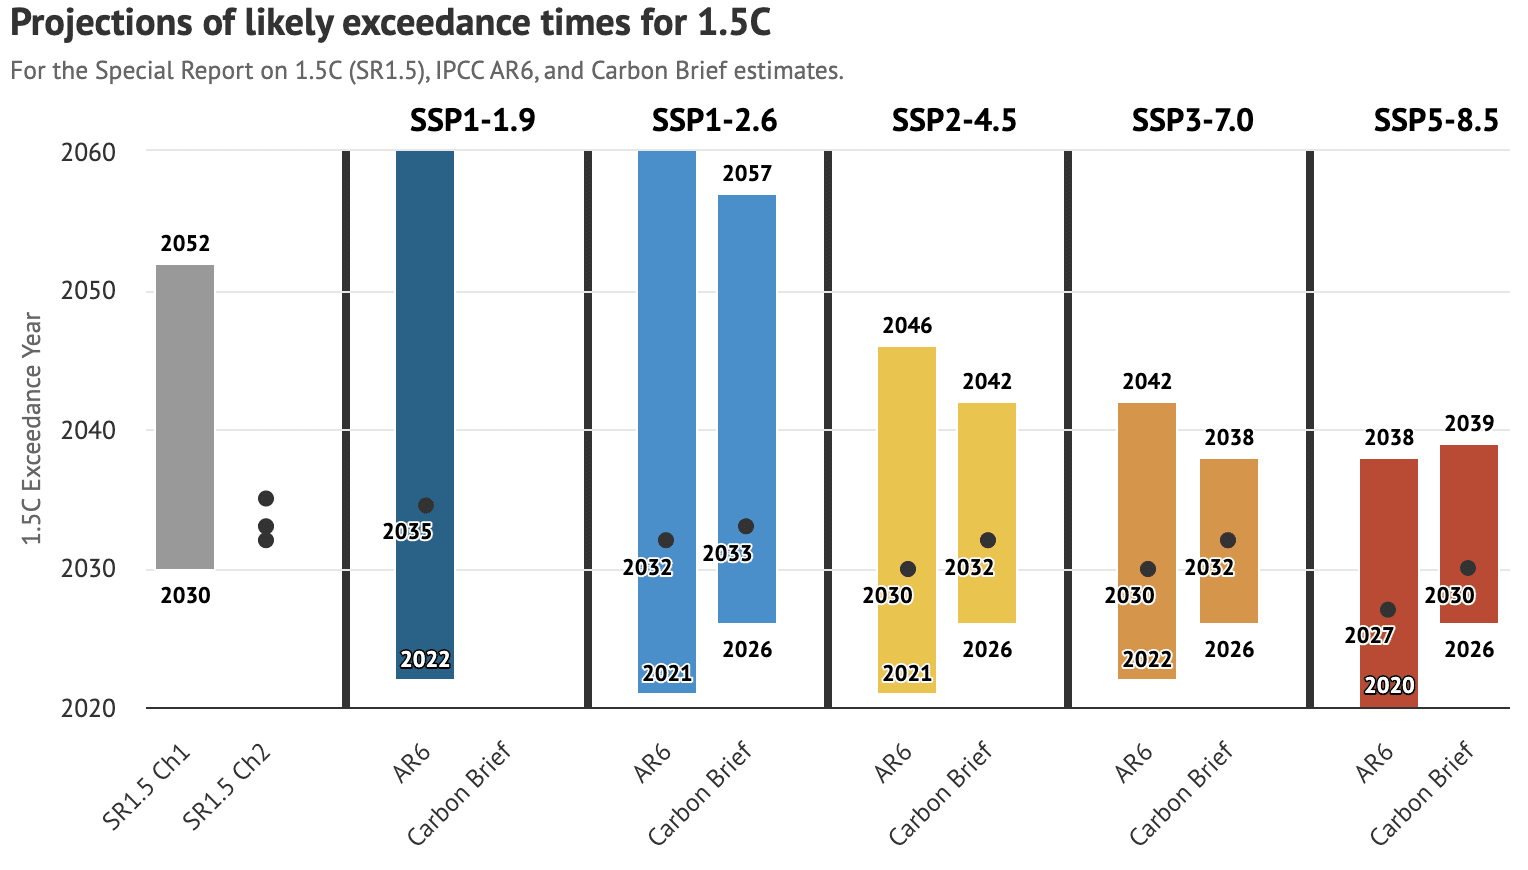
The extent of future global warming will ultimately be determined by current and future emissions decisions made by humans. However, even under the most aggressive emissions reduction scenario, the IPCC expects that the 1.5°C threshold will be crossed at around the middle of the century. Under this optimistic scenario, referred to as Shared Socioeconomic Pathway (SSP) 1-1.9 in IPCC parlance, the large-scale deployment of negative-emissions technologies, such as those that capture carbon dioxide from the atmosphere and store it for long periods of time, will be necessary to return global climate to a state of warming below 1.5°C relative to preindustrial levels by 2100. Because the Paris Agreement explicitly tasks countries with limiting end-century warming to 1.5°C, SSP 1-1.9 would still meet this international target[2].
The SSP 1-1.9 scenario requires that global emissions reach net zero by the middle of the century. Less ambitious climate scenarios (SSPs 1-2.6, 2-4.5, 3-7.0, and 5-8.5) result in both a faster rate of warming and a higher magnitude of end-century warming (Fig. 2). Under all scenarios, the best estimate for when we will cross the 1.5°C threshold is between 2027 and 2035, according to analyses by the IPCC and Carbon Brief[1,8]. These results are consistent with later work that estimated this threshold would be crossed between 2033 and 2035[7].
While we haven’t yet reached 1.5°C of warming, the IPCC notes that contemporary levels of climate change have already had widespread negative consequences for human and natural systems[6]. “Climate change is already affecting every region on Earth, in multiple ways. The changes we experience will increase with additional warming”, said Panmao Zhai, co-chair of Working Group 1 for the IPCC’s Sixth Assessment Report, in 2021. In fact, that 2022 study on climate tipping points[2] found that some of these could be triggered by just 1°C of warming, a threshold we’ve already crossed[7]. This instructs us to not mistake the climate system for a binary one. The impacts of climate change do not suddenly emerge after 1.5°C of warming, but rather become progressively more severe with every increment of additional warming beyond preindustrial levels[6].
UPDATE (2025-01-10):
We updated this article the 10th of January, 2025 to include the Copernicus Climate Change Service declaration that average global warming exceeded the 1.5°C threshold in 2024. Updates concern the first part of the article, and include information about the El Niño episode in 2024 and its influence on global temperatures recorded.
REFERENCES
1- IPCC (2018). Special report on global warming of 1.5°C
2- Armstrong McKay et al. (2022). Exceeding 1.5°C global warming could trigger multiple climate tipping points. Science
3– OMM (2024) State of the Global Climate 2023
4- Rogelj (2017). Getting it right matters: Temperature goal interpretations in geoscience research. Geophysical Research Letters
5- NAS (2016). Modes and Mechanisms of Internal Variability. In: Frontiers in Decadal Climate Variability: Proceedings of a Workshop
6- IPCC (2021). Sixth Assessment Report
7- Diffenbaugh and Barnes (2023). Data-driven predictions of the time remaining until critical global warming thresholds are reached. Proceedings of the National Academy of Sciences