- Climate
Wall Street Journal article repeats multiple incorrect and misleading claims made in Steven Koonin’s new book ’Unsettled’
Reviewed content
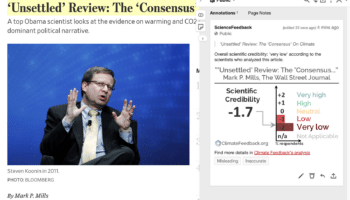
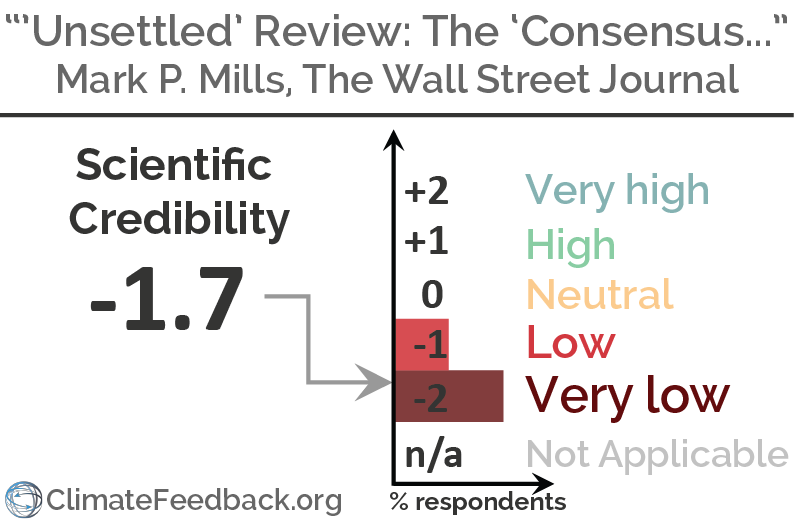
Headline: "‘Unsettled’ Review: The ‘Consensus’ On Climate"
Published in The Wall Street Journal, by Mark P. Mills, on 2021-04-25.
Summary
A Wall Street Journal article published in April 2021 reviews Steven Koonin’s book ‘Unsettled’, which is scheduled to be published in May 2021. In ‘Unsettled’, Koonin, a theoretical physicist and professor at New York University, expresses his views on climate science.
Scientists who reviewed the article found that it builds on a collection of misleading and false claims. For instance, Koonin states that “Greenland’s ice sheet isn’t shrinking any more rapidly today than it was eighty years ago”. Contrary to the claim, scientific studies using airborne and satellite altimetry observations show considerable thinning has occurred along the margin of the Greenland ice sheet since 2003[1]. As explained below by Twila Moon, from the National Snow and Ice Data Center, the per year average ice loss during 2003-2010 is roughly 2.5 times higher than during 1900-2003. Furthermore, this melting has generated a measurable sea level rise over the last 20 years[1].
Koonin also claims that “the rate of sea-level rise has not accelerated”. Contrary to the claim, scientific studies show that rates of global sea level rise have changed over time and accelerated, notably since the 1990s, primarily due to glacial ice melting and the expansion of seawater as it warms[2-5] (see a previous Climate Feedback review here). As pointed out by Zeke Hausfather, Director of Climate and Energy at The Breakthrough Institute, sea levels are rising faster now than at any point since records began in the early 1900s (see below for further details).
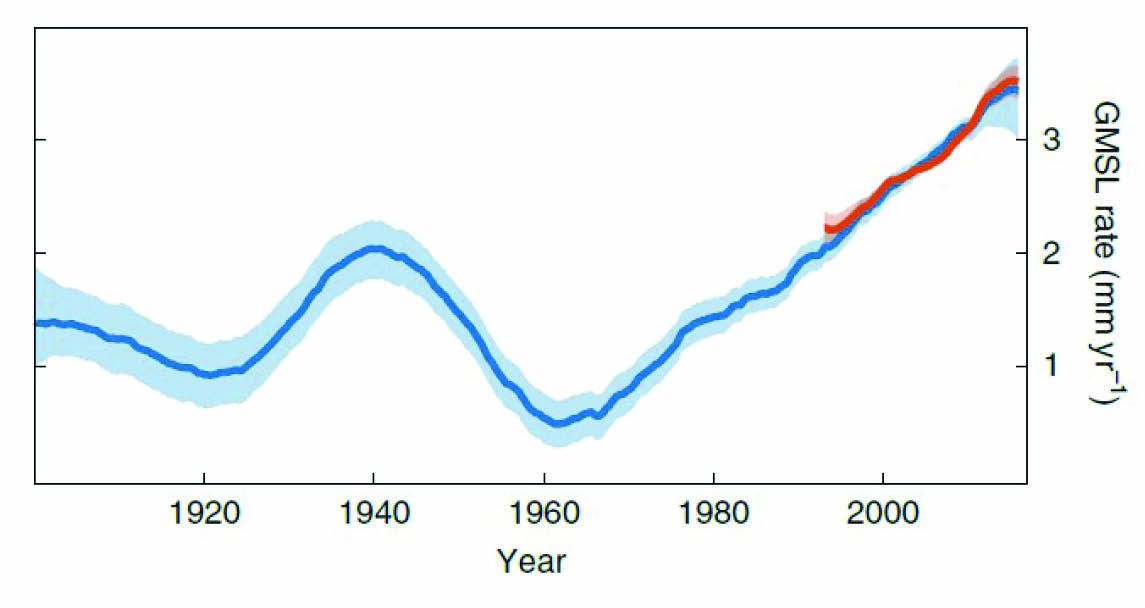
Figure 1—Global mean sea level (GMSL) trend in mm per year from 1900 to 2015, based on data from tide gauges and satellites. From Dangendorf et al. (2019)[4].
Moreover, the WSJ article repeats a series of misrepresentations about the expected consequences of climate change using a technique known as a straw man argument, as pointed out below by Kerry Emanuel, professor of atmospheric science at MIT. For instance, when stating that “tornado frequency and severity are not trending up”, the author of the article presents an assumption that climate change was expected to increase the frequency and severity of tornadoes and then refutes it, however climate science did not forecast that tornadoes should have increased already as a result of climate change to begin with.
In a similar way, the author states that “crop yields are not falling but rising”, but in fact scientists didn’t predict that crop yields would decrease due to climate change[6,7]. The author makes up false predictions about the effects of climate change and then refutes them, which has no argumentative value.
Finally, the article also includes misleading claims from Koonin’s book, notably one about the role of climate change in wildfire trends. Koonin uses the observed decline in global average area burnt to discard the impact of climate change on wildfires. As Hausfather describes below, “he is conflating purposefully set agricultural fires (which are decreasing) with wildfires that are increasing in many regions due to climate change”[8,9]. For example, in the western U.S., human-caused climate change doubled the cumulative forest fire area since 1984, as shown in the figure below[10]. For further details, see a previous Climate Feedback review here.
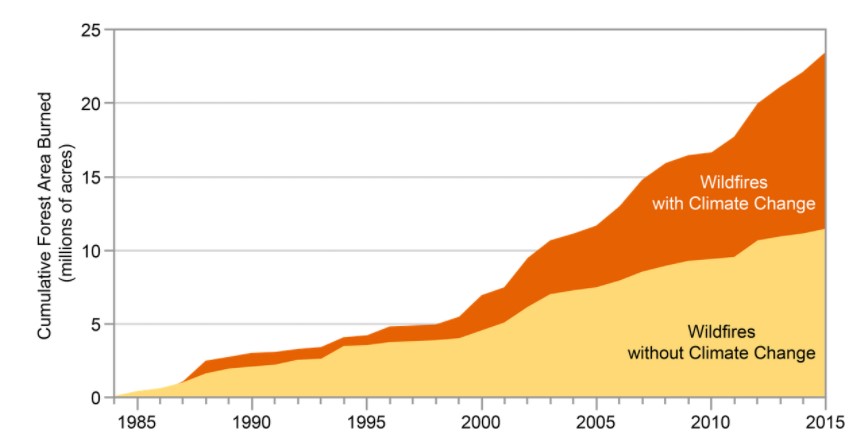
Figure 2—Cumulative forest area burned by wildfires in the western US from 1984-2015. From Fourth National Climate Assessment (2018)[10].
Reviewers’ Overall Feedback
These comments are the overall assessment of scientists on the article, they are substantiated by their knowledge in the field and by the content of the analysis in the annotations on the article.

Climate Research Lead, Stripe
The Wall Street Journal article reviewing Dr. Steven Koonin’s new book is a mix of factually correct, correct but misleading, and inaccurate statements. It seems to be cherry-picking different datasets and factoids to downplay the severity of future climate impacts. For example, while Koonin mentions that global area burned by fires is decreasing, he is conflating purposefully set agricultural fires (which are decreasing) with wildfires that are increasing in many regions due to climate change. Similarly, he highlights one dataset that suggests some ambiguity about whether the rate of sea level rise today exceeds that of the 1940s, while ignoring four other datasets that show clear modern acceleration (see below). Finally, his criticism that climate models have poor skill in “retroactive prediction” ignores the fact that climate models published since the 1970s were quite accurate in projecting the warming that actually occurred in the years after they were published, as we discuss in our recent paper[11].
This book review uncritically regurgitates an assortment of misleading and/or outright false claims that presumably appear in the underlying volume. As has been thoroughly emphasized by scientists here and elsewhere, climate change is clearly increasing the frequency and/or severity of different kinds of extreme weather events in the United States and elsewhere (including heat waves), has indeed resulted in an accelerating rate of sea level rise, and has very large societal and economic implications.

Research Scientist, University of Colorado, Boulder
Many conclusions highlighted in this article are examples of cherry-picking information and failing to provide the context of change. In other instances, statements are fully wrong and unsupported by scientific research.

Professor Emeritus of Atmospheric Science, MIT
Early in the review, the novelist Michael Chrichton is quoted as saying “If it’s consensus, it isn’t science. If it’s science, it isn’t consensus. Period.” But those making policy would be foolish not to go with a scientific consensus; anything else would almost by definition be subjective. What is the point of quoting Chrichton if not to cast doubt on the value of scientific consensus? The existence of a consensus is not at all tantamount to the idea that the “science is settled”.
Annotations
The statements quoted below are from the article; comments are from the reviewers (and are lightly edited for clarity).
”Greenland’s ice sheet isn’t shrinking any more rapidly today than it was eighty years ago.”
Research Scientist, University of Colorado, Boulder
This statement is untrue. The per year average ice loss during 2003-2010 is roughly 2.5 times higher than during 1900-2003. This is evident in the following figure from Kjeldsen et al.[1]
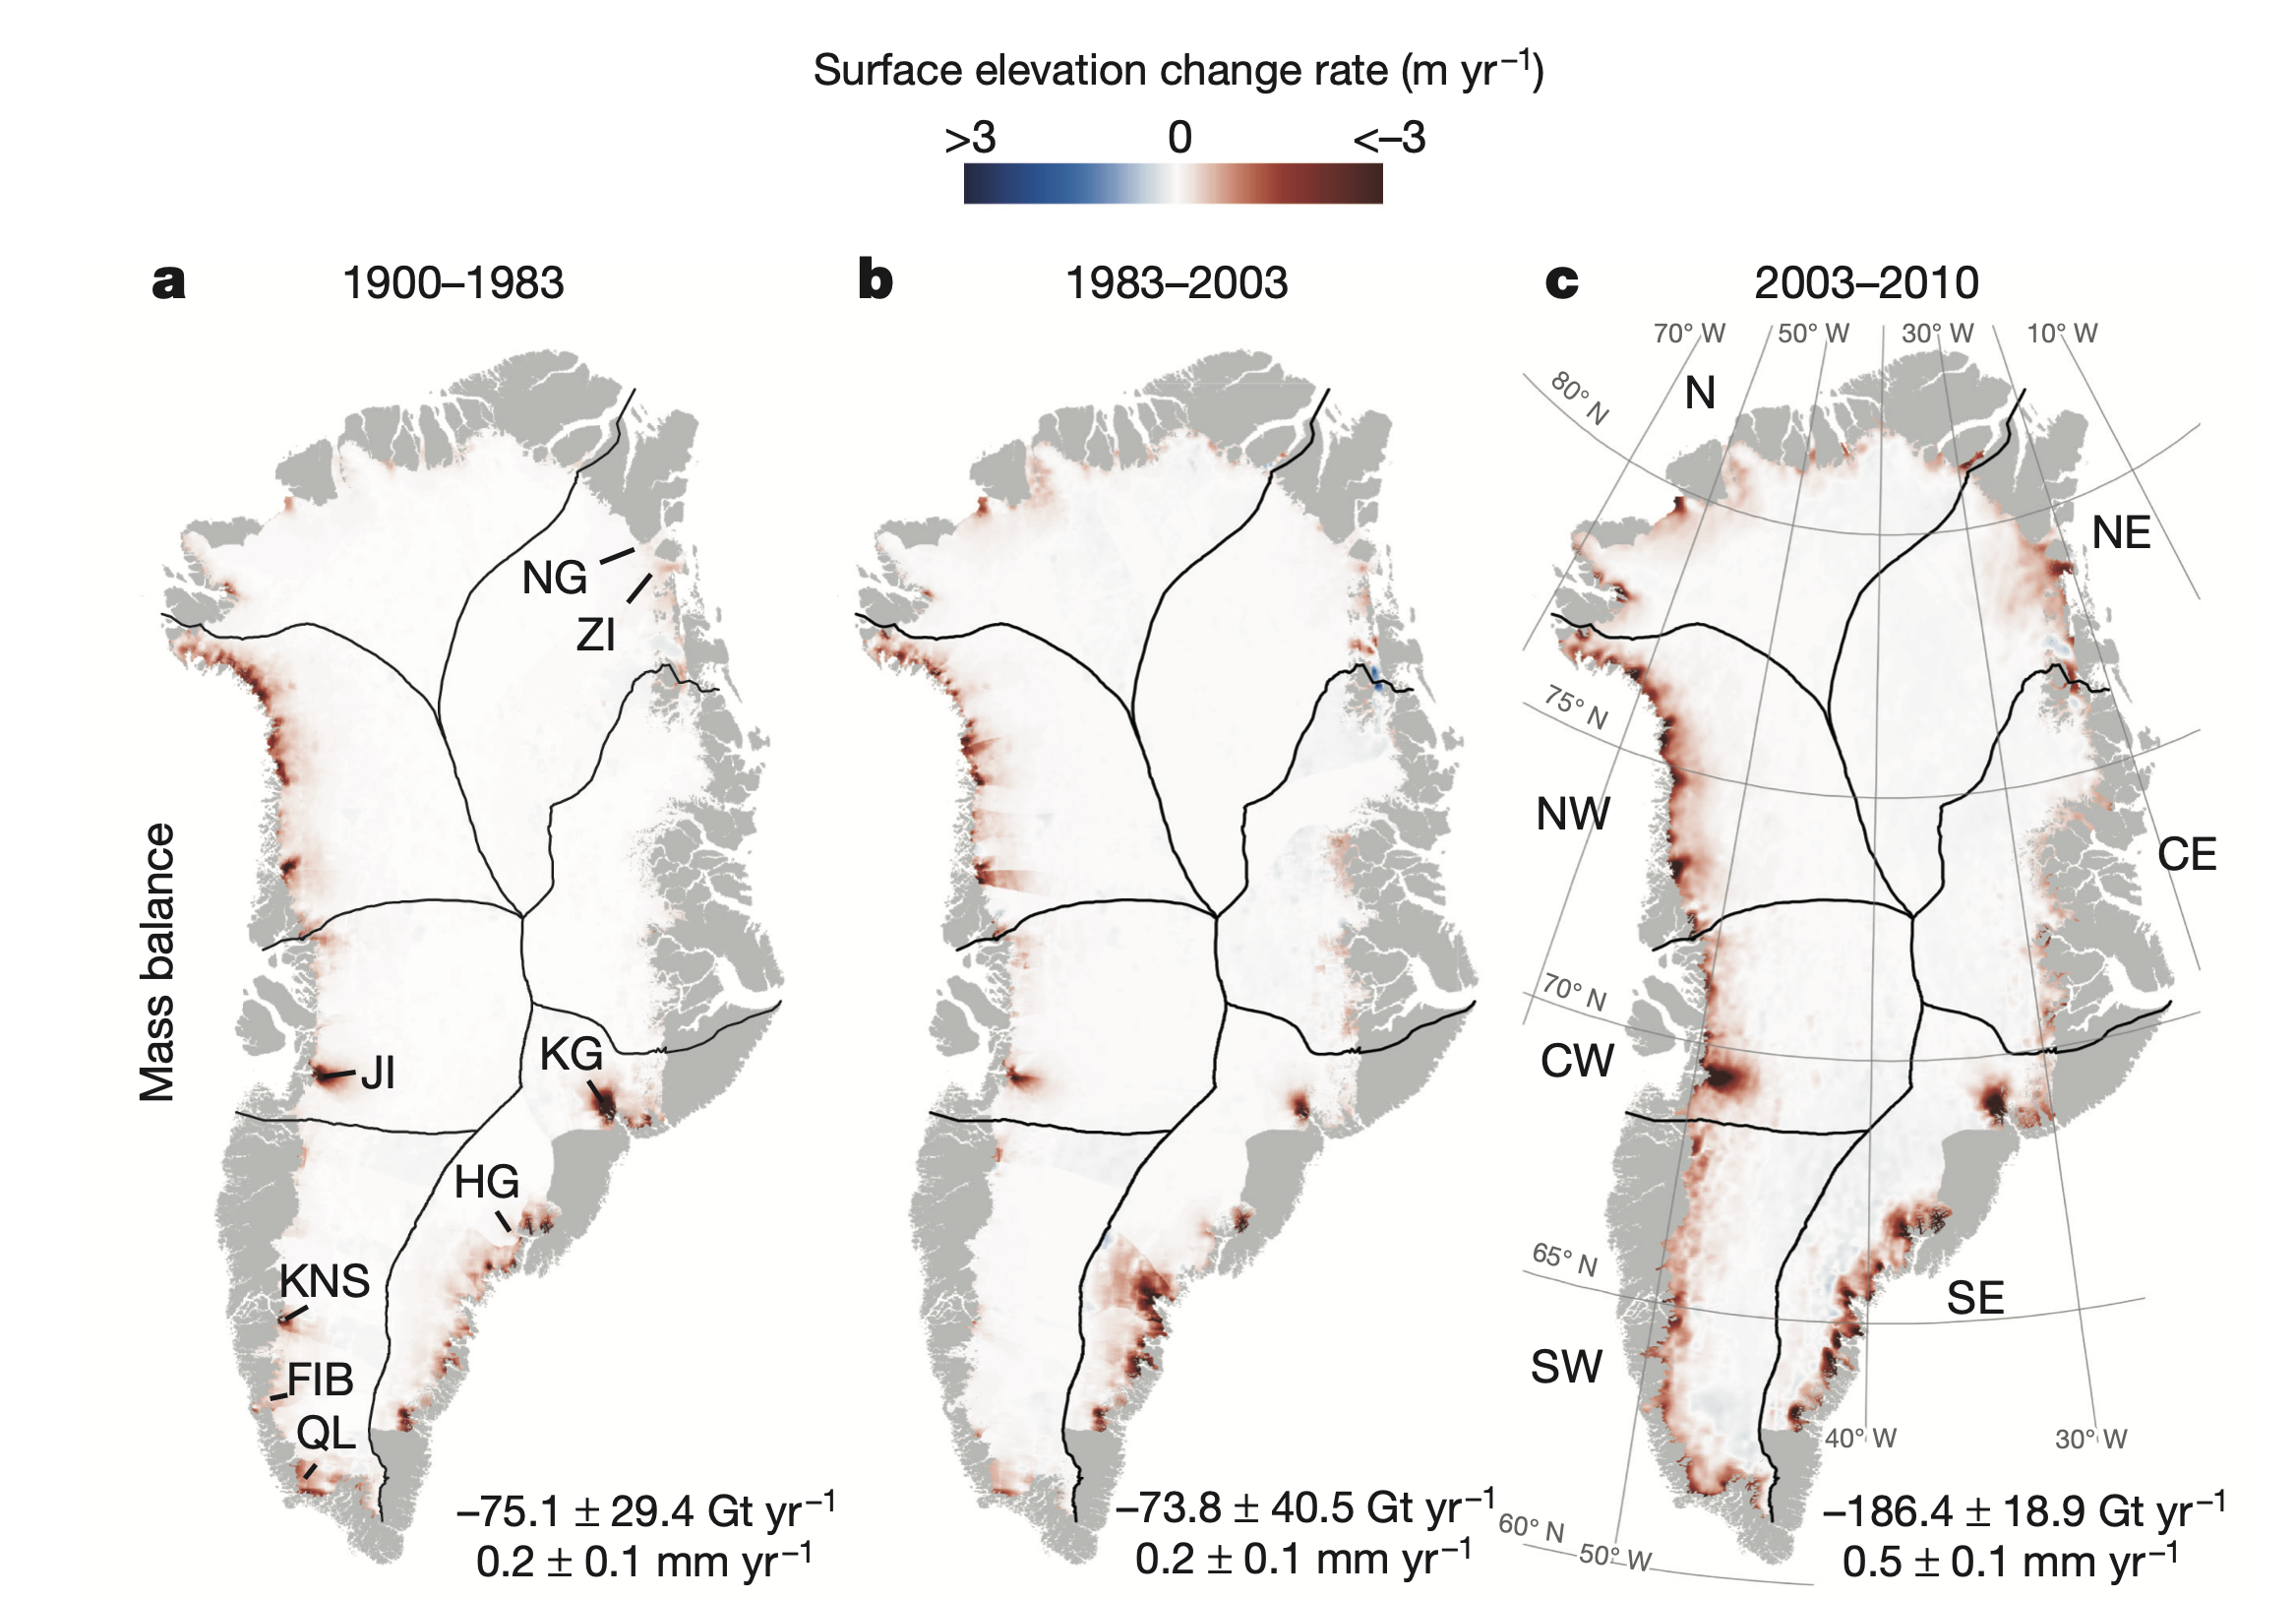
Figure 3 — Surface elevation change rates in Greenland during 1900-1983 (a), 1983-2003 (b), and 2003-2010 (c). The numbers listed below each panel are the integrated Greenland-wide mass balance estimates expressed as gigatonnes per year and as millimetre per year GMSL (global mean sea level) equivalents. From Kjeldsen et al. 2015[1].
If we look in more detail at changes over 1972-2018, we can further see that the ice sheet was mostly in balance (gain about the same amount of snow/ice in winter as is lost in summer) during the 1970s and 1980s[12]. It was only in the mid-1990s that Greenland ice loss began to increase more substantially.
Over the last 20 years, ice loss has been rapid and large, creating measurable sea level rise, which we experience as increases in coastal erosion, flooding, problems with water and sewer systems at the coasts, and saltwater inundation of freshwater sources.
”The rate of sea-level rise has not accelerated.”
Climate Research Lead, Stripe
This statement is inaccurate; all observational sea level rise (SLR) datasets show rapid acceleration in recent years, and most now show sea levels rising faster than at any point since records began in the early 1900s.
Reconstructing past changes in global sea levels is far from a simple task. While high-quality satellite measurements with global coverage have been available since the early 1990s, prior to that researchers had to rely on tide gauges scattered around the world.
These tide gauges primarily cover coastal regions, leaving it up to researchers to figure out how best to fill the gaps. Tide gauges are also subject to factors that can complicate the interpretation of local sea level changes, namely subsidence (sinking land) or isostatic rebound (rising land due to melting glaciers). The IPCC 5th Assessment Report featured three estimates of global sea level rise[6]: from Church and White[13], Jevrejeva[14], and Ray and Douglas[15]. Two additional SLR datasets – Hay et al.[16] and Dangendorf et al.[17] – have been published in recent years.
All five of these datasets are shown in the figure 5 below (coloured lines), along with satellite altimeter measurements (in black) after 1993.
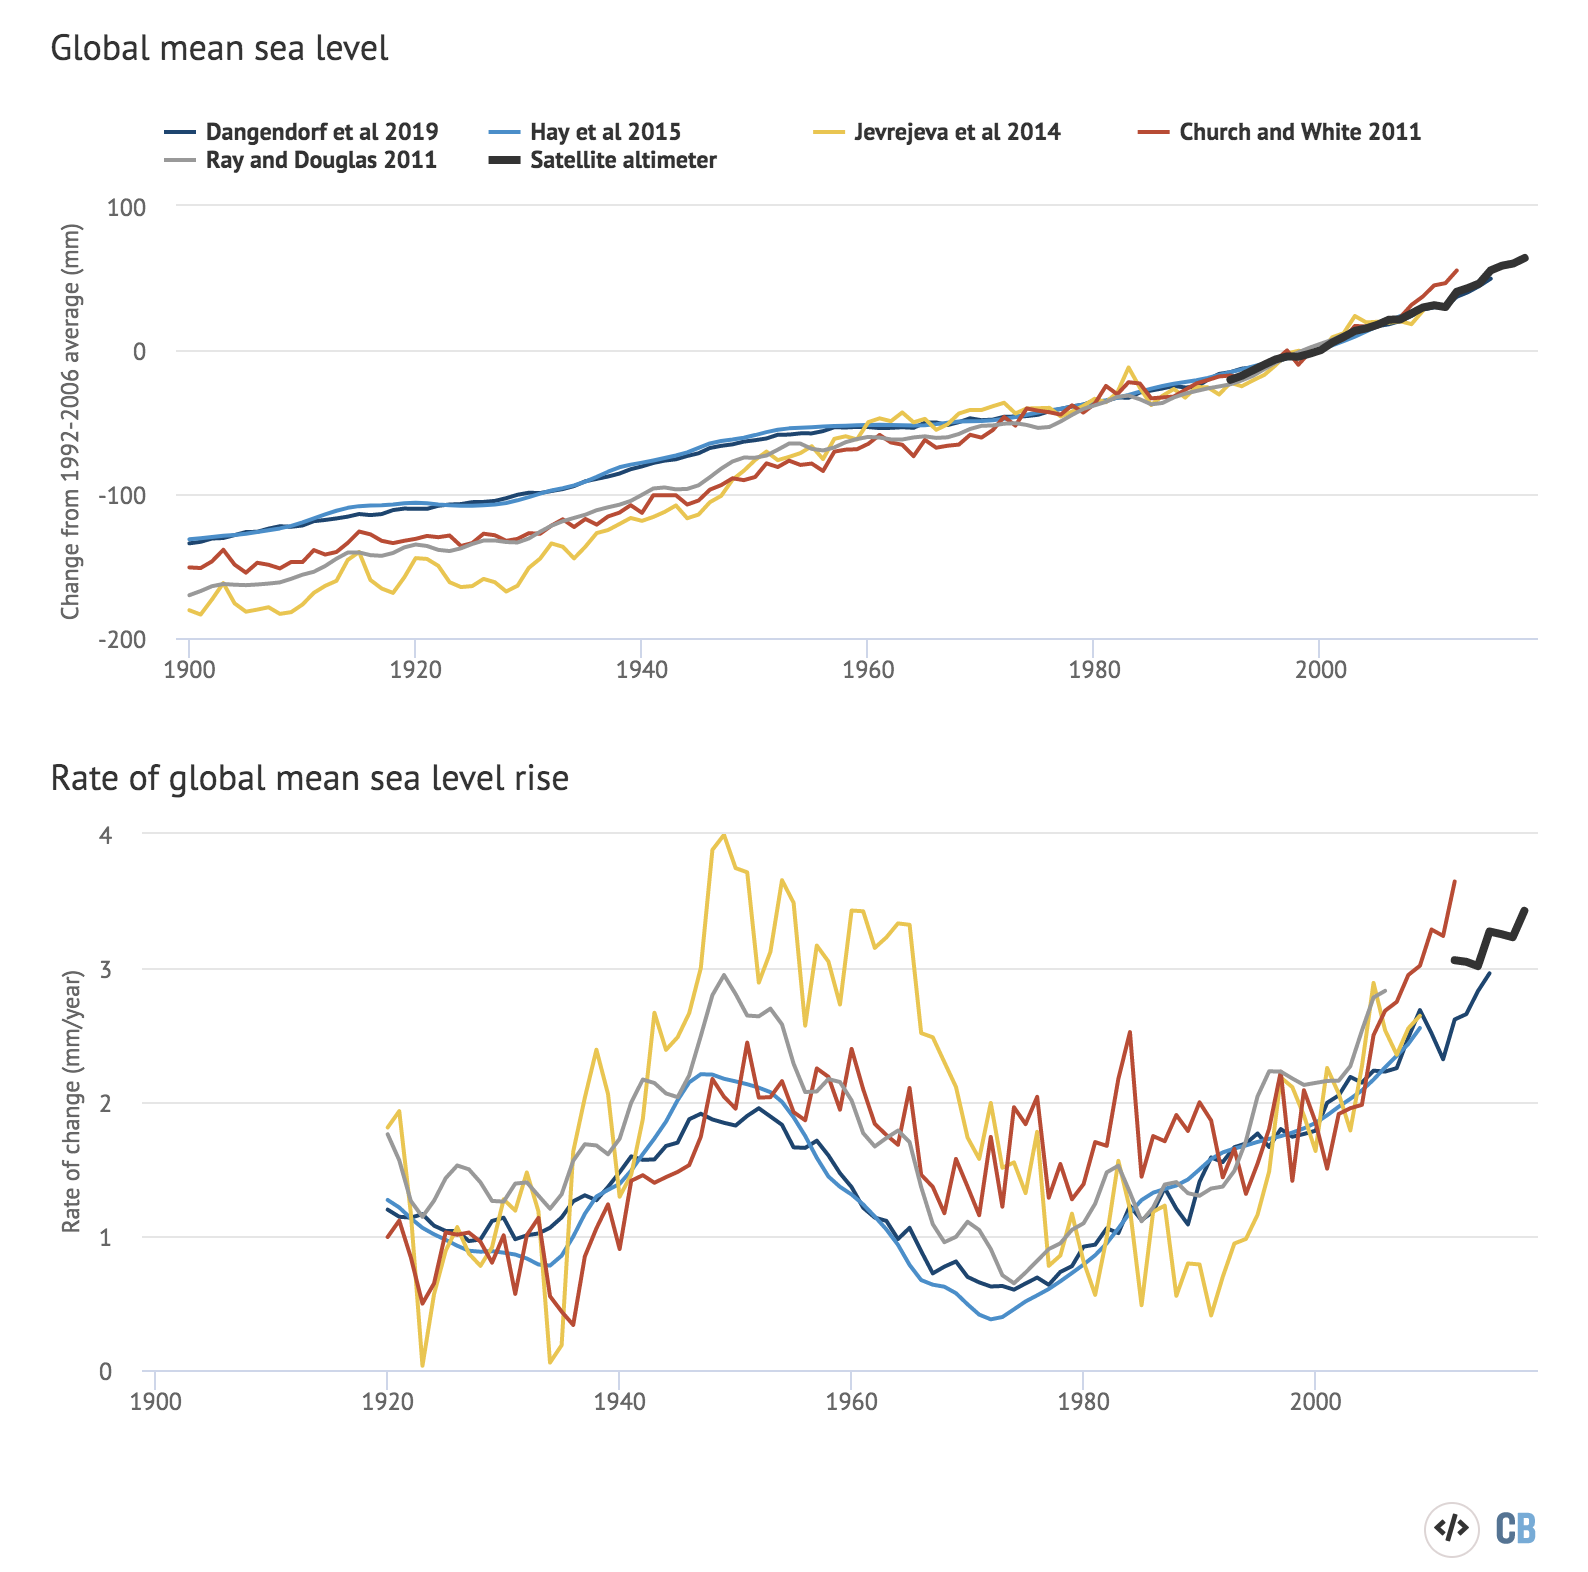
Figure 4— Estimates of global mean sea level from 1992-2006 (in millimetres), and 20-year average rate of global sea level rise (mm/year) from various references. From Carbon Brief.
Recently, there has been some debate around whether the current rate of SLR exceeds that experienced back in the 1940s. Three of the five datasets (Dangendorf, Hay, and Church and White) suggest that the current rate of sea level rise – as measured by accurate satellite altimeters – is around 50% faster than was experienced in the 1940s. The Ray and Douglas dataset suggests that current rates of SLR measured by satellite altimeters are modestly above the 1940s peak, while one of the five – Jevrejeva – suggests that the current rate of SLR is below that of the 1940s. However, even the authors of the Jevrejeva dataset suggest in their accompanying paper that a longer view of sea level – from 1800 to present – still suggests that “the rate of sea level rise is increasing with time”[14].
There is also evidence of accelerating SLR over the post-1993 period when high-quality satellite altimetry data is available. According to the 2018 State of the Climate report[18], acceleration in SLR during the post-1993 period is around 0.1mm each year; this means that the rate of SLR is increasing by 1mm per year each decade.
For more details, see my discussion of sea level rise acceleration at Carbon Brief.

Postdoctoral researcher, Jet Propulsion Laboratory/California Institute of Technology
Satellite measurements, which started in 1993, show a clear acceleration in sea level [19]. Also, if we go further back in time, tide-gauge observations show that sea levels are persistently accelerating since the 1960s[4], and overall, the observed sea-level rise during the 20th century is higher than during any other century over the last 3000 years[20,21].
[Comment from a previous evaluation of a similar claim]
This is literally the opposite of what a growing body of recent evidence has shown. Research actually shows that rates of global sea level rise have accelerated in recent years[19], and estimates regarding the upper end of plausible further sea level rise over the coming century have actually increased considerably as the non-linear contribution by continental ice sheets comes into clearer focus[22]. So, if anything, sea level rise is becoming more of a problem than previously thought.
”The extent of global fires has been trending significantly downward.”
Climate Research Lead, Stripe
This statement is accurate but misleading. The vast majority of fires globally are purposefully set for agricultural clearing, and these have declined in recent years. Conflating all fires with forest and wildfires is not helpful in understanding changing drivers of fire risk.
A 2014 study suggests that in the tropics climate change may have also reduced the area burned over the past 50 years, due, in part, to wetter conditions[23]. However, they find that climate change has likely increased fire risk in the high latitudes and mid-latitudes over recent decades.
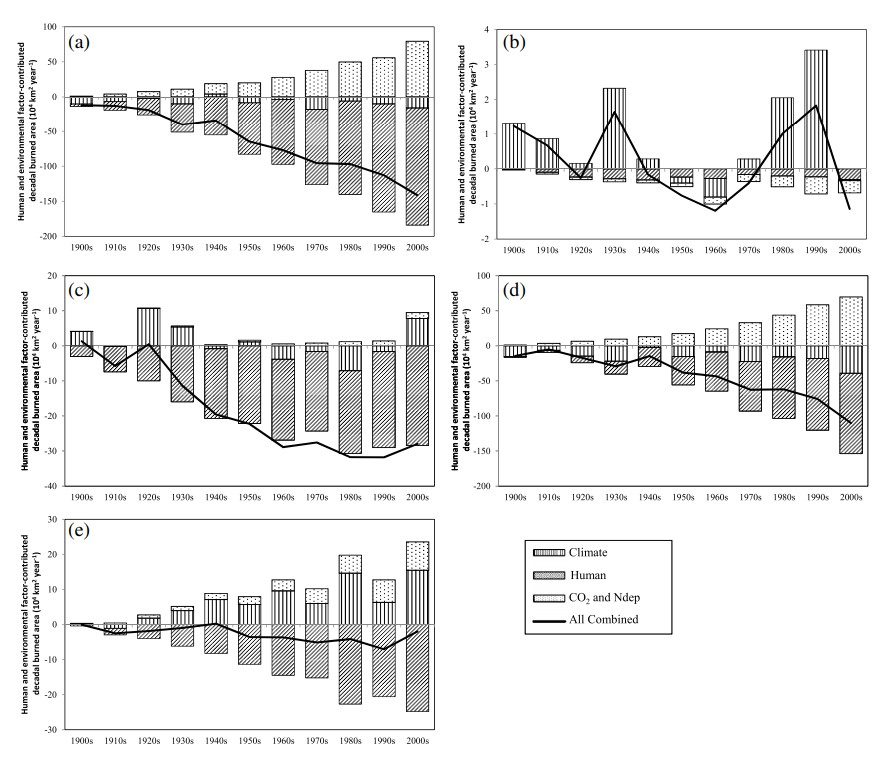
Figure 5 —Contribution of different factors in changes since 1900 in forest-fire area globally (a) and for different regions : (b) northern high latitudes (>55°N), (c) northern extratropics (55°N to 30°N), (d) tropics (30°N to 20°S), and (e) southern extratropics (>20°S). Effects of climate change (including changes in temperatures and precipitation) are shown by the vertical stripes. Human land management activity is shown by the diagonal stripes, while the effect of CO2 fertilization and nitrogen deposition is shown by the dots. From Yang et al. (2014)[23].
Hotter and drier conditions have been a major factor in the increase in areas burned by wildfires in many regions – such as the western US – in recent years. For example Williams et al. (2019) found that in California, “nearly all of the increase in summer forest‐fire area during 1972–2018 was driven by increased VPD [vapor pressure deficit]” driven by climate change[24]. Earlier work by Abatzoglou and Williams (2016) found that fuel aridity – driven by observed warming and drying – was the major driver of enhanced fire activity in the Western US[25].
For more details, see my Carbon Brief analysis of the role of climate change in US wildfires.
[Comment from a previous evaluation of a similar claim]
Overall trends in area burned globally are strongly driven by decreases in intentional agricultural burning in tropical areas, which is not related to climate change. In regions where non-agricultural fires occur naturally (including the western United States[24-26], eastern Australia[27], and the Siberian Arctic[28], there is strong evidence that climate change has already increased the severity and extent of wildfire[29].
[Comment from a previous evaluation of a similar claim]
The observed decline in global average area burned has been misused numerous times to support false claims about the role of climate change in wildfire trends. Climate change as well as human activities affect global fire activity (see here for a summary and update on Doerr and Santin, 2016[8]).
The overall global decrease is mostly driven by less fire in what used to be more extensive savannahs and grasslands and is largely due to the human driven removal of flammable vegetation. In quantitative terms, fire in those grassy ecosystems account for around 70% of the total global area burnt, so the reduction in fire activity here outweighs the increase in burned area that we are seeing in other parts of the world over the last two decades where fires have greater impacts such as Canada, parts of the USA or Siberia.
In other words, where humans have not converted flammable landscapes to less or-non flammable landscapes by removing or changing the vegetation, warming temperatures are, overall, associated with an increase in fire activity. A very thorough global analysis of trends and fire knowledge overall has been made by Bowman et al. in 2020[9].

Professor of Economics and Environmental Studies, Wesleyan University
Fires are local events whose regional patterns of intensity and frequency fit well into risk-based calibrations. They can also be perfect examples of a new troubling tendency in which several types of impacts attributed to climate change show up at the same place at the same time, feeding on each other combining forces to produce still greater extremes – something that long-term trends of one type of climate change impact simply cannot explain.
Take, for example, the 2020 California fire experience. Only three of the state’s largest 20 fires (in terms of acres burned) had burned prior to 2000, but nine of the biggest 10 have occurred since 2012. That is, moving toward the next decade, extreme fires were becoming more likely and more intense. In 2017, 9,270 fires burned a record 1.5 million acres.
The Mendocino Complex fire the next year became the “largest wildfire in California history.” And then came 2020. A new largest fire in California history, the Complex fire, started in August of 2020. Soon after came the 3rd, 4th, 5th, and 6th largest in history. By October 3, these five conflagrations had combined with nearly 8,000 other more “ordinary” fires to kill 31 people and burn more than four-million acres; and, on that day, all five were still burning at the same time.
Why is this happening? It is becoming clear that nature can produce combinations of influences on local environmental conditions. Many of the 2020 fires in California were caused by literally thousands of dry lightning strikes that fed into a witches’ brew of simultaneous conditions that have all been linked to global warming:
- the end of a multi-year record drought
- all-time record heat punctuated July, August, and much of September
- widespread tinderbox stands of dead trees from multi-year and growing infestations of bark beetles
- decades of normal warming that had extended the western fire season by some 75 days
”tornado frequency and severity are also not trending up; nor are the number and severity of droughts.”
Professor Emeritus of Atmospheric Science, MIT
Koonin sets up a strawman in claiming that tornado frequency and severity are not trending up. The scientific consensus on this is that we simply do not have the data to determine trends in tornadoes, and what little theoretical work has been done on this suggests that severity might go up and frequency might go down, but again there is no real consensus.
[Comment from a previous evaluation of a similar claim]
There is relatively little evidence in either direction at this point in time regarding global or even regional trends in tornado frequency/intensity. This is largely due to sparse and temporally inhomogeneous historical records in the United States, and virtually non-existent records in other regions. There is some evidence of regional shifts in tornado frequency[30], and perhaps an increase in overall tornado “power” in the United States[31], but in general there is an absence of strong evidence regarding this claim.
Future projections regarding climate change and tornado risk are of somewhat low confidence, but there is evidence that atmospheric environments favorable for severe convective storms (which are the types of storms capable of producing tornadoes) may increase in the future due to climate warming[32,33].

Project Scientist, National Center for Atmospheric Research
[Comment from a previous evaluation of a similar claim]
It is not clear if climate change will make U.S. tornadoes worse or more frequent. The observational record does not show any significant change in the frequency of U.S. tornadoes in the last 60 years but there is a tendency that more tornadoes occur during big outbreak days[34] and there are spatial shifts in the occurrence of tornadoes[30]. Whether these changes are related to climate change is, however, unclear.
” the number and severity of droughts are also not trending up.”
[Comment from a previous evaluation of a similar claim]
Observed spatial trends in global hydroclimate over the past century have been consistent with those expected from human influence in the climate system[35]. In many mid-latitude and subtropical regions, this has indeed included an increase in the frequency/intensity of drought[36,37]–but in other regions (such as the Northern Hemisphere high latitudes), this includes an increase in moisture availability and decrease in drought (as expected from climate model simulations). Therefore, it doesn’t really make sense to make blanket statements regarding overall global drought trends, since only some places are expected to get drier (and others wetter) in a warming climate.
“Humans have had no detectable impact on hurricanes over the past century”
Professor Emeritus of Atmospheric Science, MIT
This statement is flat out wrong. In the first place, the theoretically predicted trends would not have been detectable in the sparse and noisy hurricane record until recently, and in fact they HAVE recently been detected. The most up-to-date research published in the Proceedings of the National Academy of Sciences demonstrates an increase in the proportion of hurricanes that become major hurricanes (Category 3-5) globally, supporting theoretical predictions that date back to 1987 (see figure below)[38].
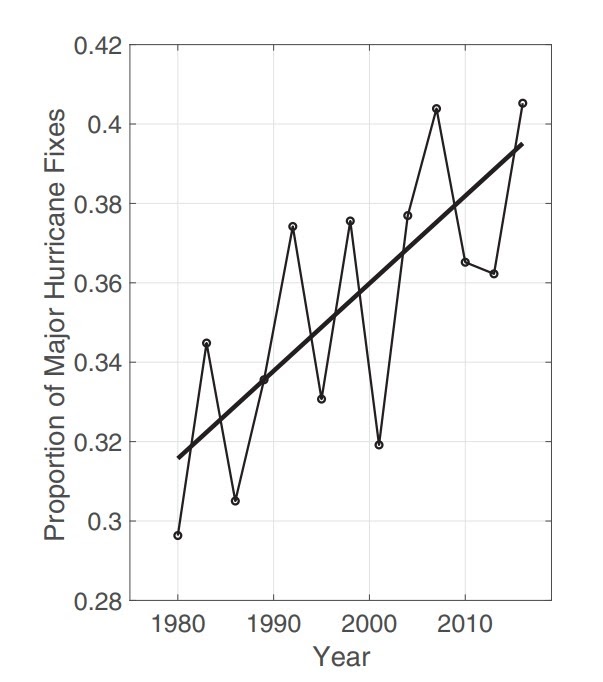
Figure 6—The proportion of major hurricane intensities to all hurricane intensities globally from 1979-2017. Data is binned into 3-year periods. The proportion of global major hurricanes increased by 25% over the 39-year time period analyzed. From Kossin et al. (2020)[38].
Furthermore, the phrase “in the past century” is telling nothing since no one familiar with the global record of tropical cyclones would look at data prior to 1980; it is just way too poor to be able to detect trends.
[Comment from a previous evaluation of a similar claim]
While there remains no strong evidence for an increase in tropical cyclone (hurricane) frequency on a global basis, there is evidence that the most intense tropical cyclones are indeed becoming stronger in terms of maximum wind speeds and minimum central pressure[38] and are producing more extreme rainfall[39].
In fact, these trends are consistent with predictions regarding tropical cyclone behavior due to global warming: there is a strong expectation that the maximum potential intensity of hurricanes will increase due to rising ocean temperatures, even as the overall frequency of such storms does not change greatly or perhaps even decreases[40].
”Global crop yields are rising, not falling.”

Assistant Professor, University of California Davis
While global crop yields are rising, this does not constitute evidence that climate change is not adversely affecting agriculture. IPCC estimates are that increased heat and drought resulting from anthropogenic warming will slow the rate of yield growth, not reverse it[6]. Given a growing population and rising incomes, this will place increasing strain on the global food supply. A recent paper by Ortiz-Bobea et al. (2021) found that anthropogenic warming since 1961 removed the equivalent of 7 years of productivity growth[7]. The effect is substantially more severe in warmer regions such as Africa and Latin America and the Caribbean. Moreover, the authors concluded that “Global agriculture has grown more vulnerable to ongoing climate change”.

Associate Professor, Stanford University
This statement implies that people are claiming global crop yields are falling, which is false. it also is a logical fallacy to say that if things aren’t causing a net decrease then it isn’t a concern. One could say the economy is larger than it was 30 years ago, so nothing hurting the economy is a concern. Or global health is better, so a pandemic is no big deal.
”The net economic impact of human-induced climate change will be minimal through at least the end of this century.”
Professor of Economics and Environmental Studies, Wesleyan University
It is impossible to support a statement like this because economic damages are very dependent on unpredictable investments in adaptation and because sectoral coverage of the aggregate economy is woefully incomplete. A much more honest statement should read something like this from the IPCC Fifth Assessment: “there is low to medium confidence in attribution of climate change influence on a few sectors… Risks of global aggregate impacts are moderate for additional warming between 1°C to 2°C compared to 1986–2005… Aggregate economic damages accelerate with increasing temperature (limited evidence, high agreement) but few quantitative estimates have been completed for additional warming around 3°C.”
Since 2014, more comprehensive studies have offered still incomplete portraits of the correlations between distributions of net economic damage (not just fitted values) along alternative global development pathways and increases in global mean temperature[41]. See figure below :
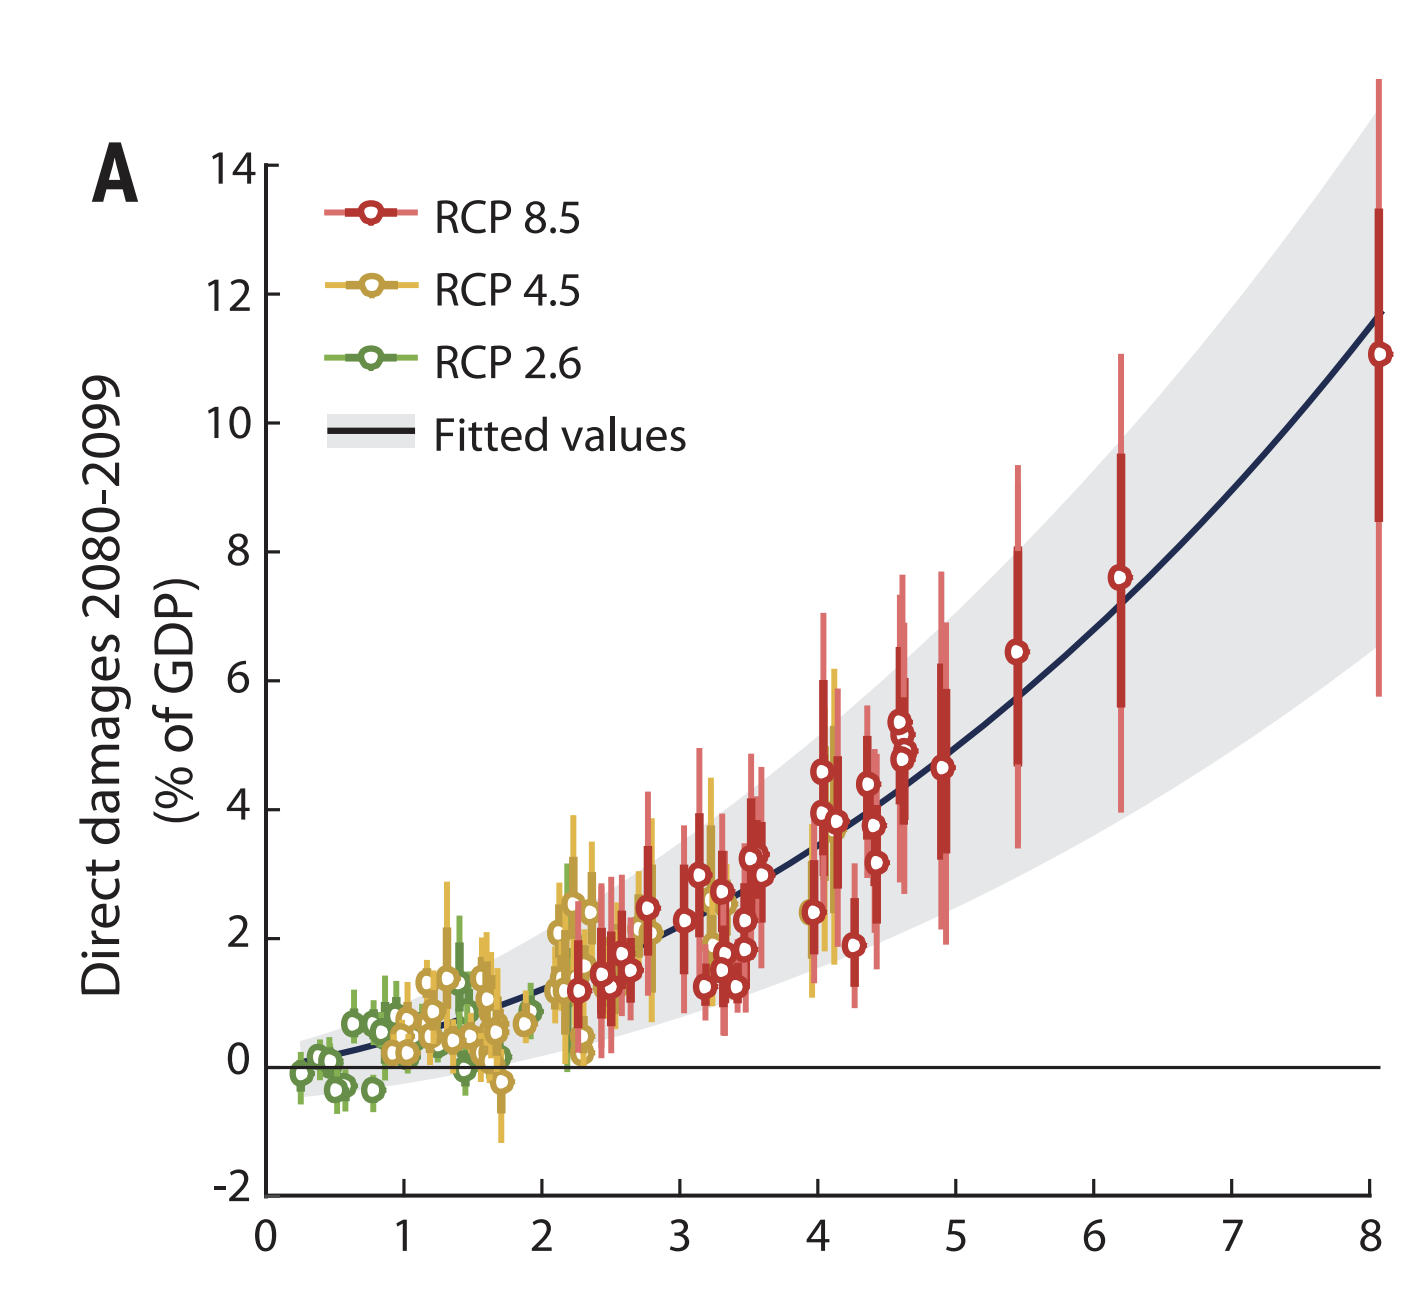
Figure 7 — Estimates of total direct damages across all sectors from climate change on the U.S. economy. The x-axis refers to temperature change (°C) for 2080-2099 relative to 1980-2010. From Hsiang et al. 2017[41].
”while global atmospheric CO2 levels are obviously higher now than two centuries ago, they’re not at any record planetary high—they’re at a low that has only been seen once before in the past 500 million years.”

Curator and Research Scientist, Department of Paleobiology, Smithsonian Institution
This statement is incorrect. CO2 levels were lower than today’s at every glacial maximum for the last 800,000 years[42], as revealed by ice core records (see Figure 8 below).
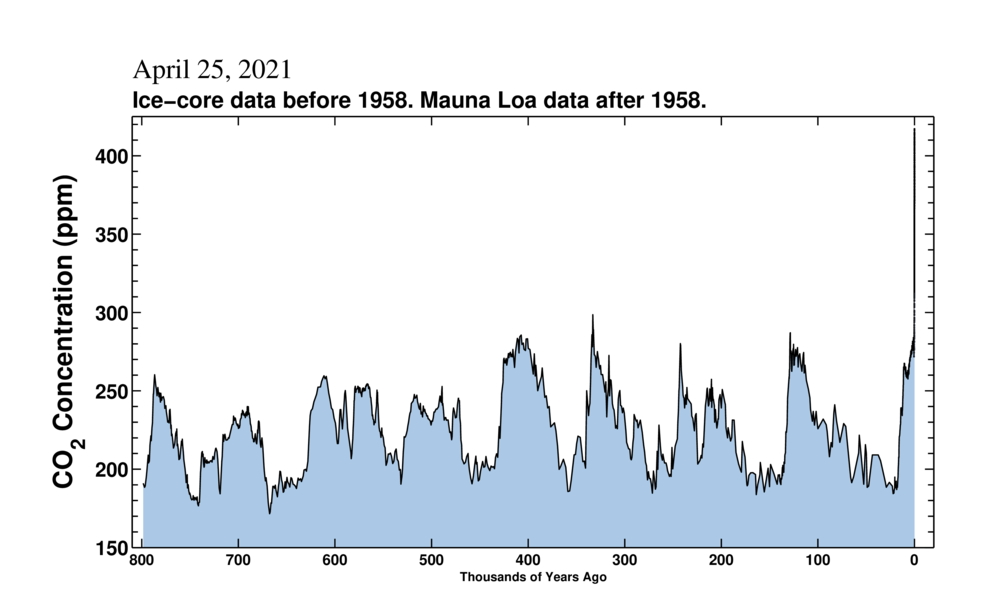
Figure 8 — Past CO2 concentration obtained from air trapped in ice cores from Antarctica. From https://keelingcurve.ucsd.edu
For times before ice cores (>800,000 years) CO2 levels have to be inferred less directly from geochemical or biological proxies. These proxies have larger uncertainties associated with them than direct measurements or ice cores. Still, today’s levels are thought to be similar to those for the Pliocene and late Miocene, 2-10 million years ago. Of course polar ice caps were much smaller and sea levels much higher when CO2 was as high as it is now.
Going farther back atmospheric CO2 concentrations becomes less certain, but probably it was higher than present during much of the long warm period prior to Antarctic glaciation beginning 34 million years ago and going back to the last major ice age in the Carboniferous, about 300 million years ago[43].

Professor, PennState University
This statement is misleading. Yes, atmospheric CO2 levels have been much higher than they are now in the VERY DISTANT geological past. But 500 million years ago the sun was dimmer than today, and high CO2 levels compensated for low irradiance. As the sun has become brighter over the history of our planet, CO2 levels in general have fallen, keeping our planet habitable[44]. So statements like “record planetary high” are meaningless. What’s meaningful is that at over 400 parts per million, the atmosphere today has a carbon dioxide level that Earth hasn’t seen in the last 2-5 million years, and climates at that time were warmer than today, ice sheets were smaller, and sea level was higher. Various scenarios for fossil-fuel burning take us above 1000 ppm in the next several decades, a level not seen for over 50 million years and at a time without ANY significant ice sheets on the planet and a much warmer climate (at least 10°F warmer on a global average).
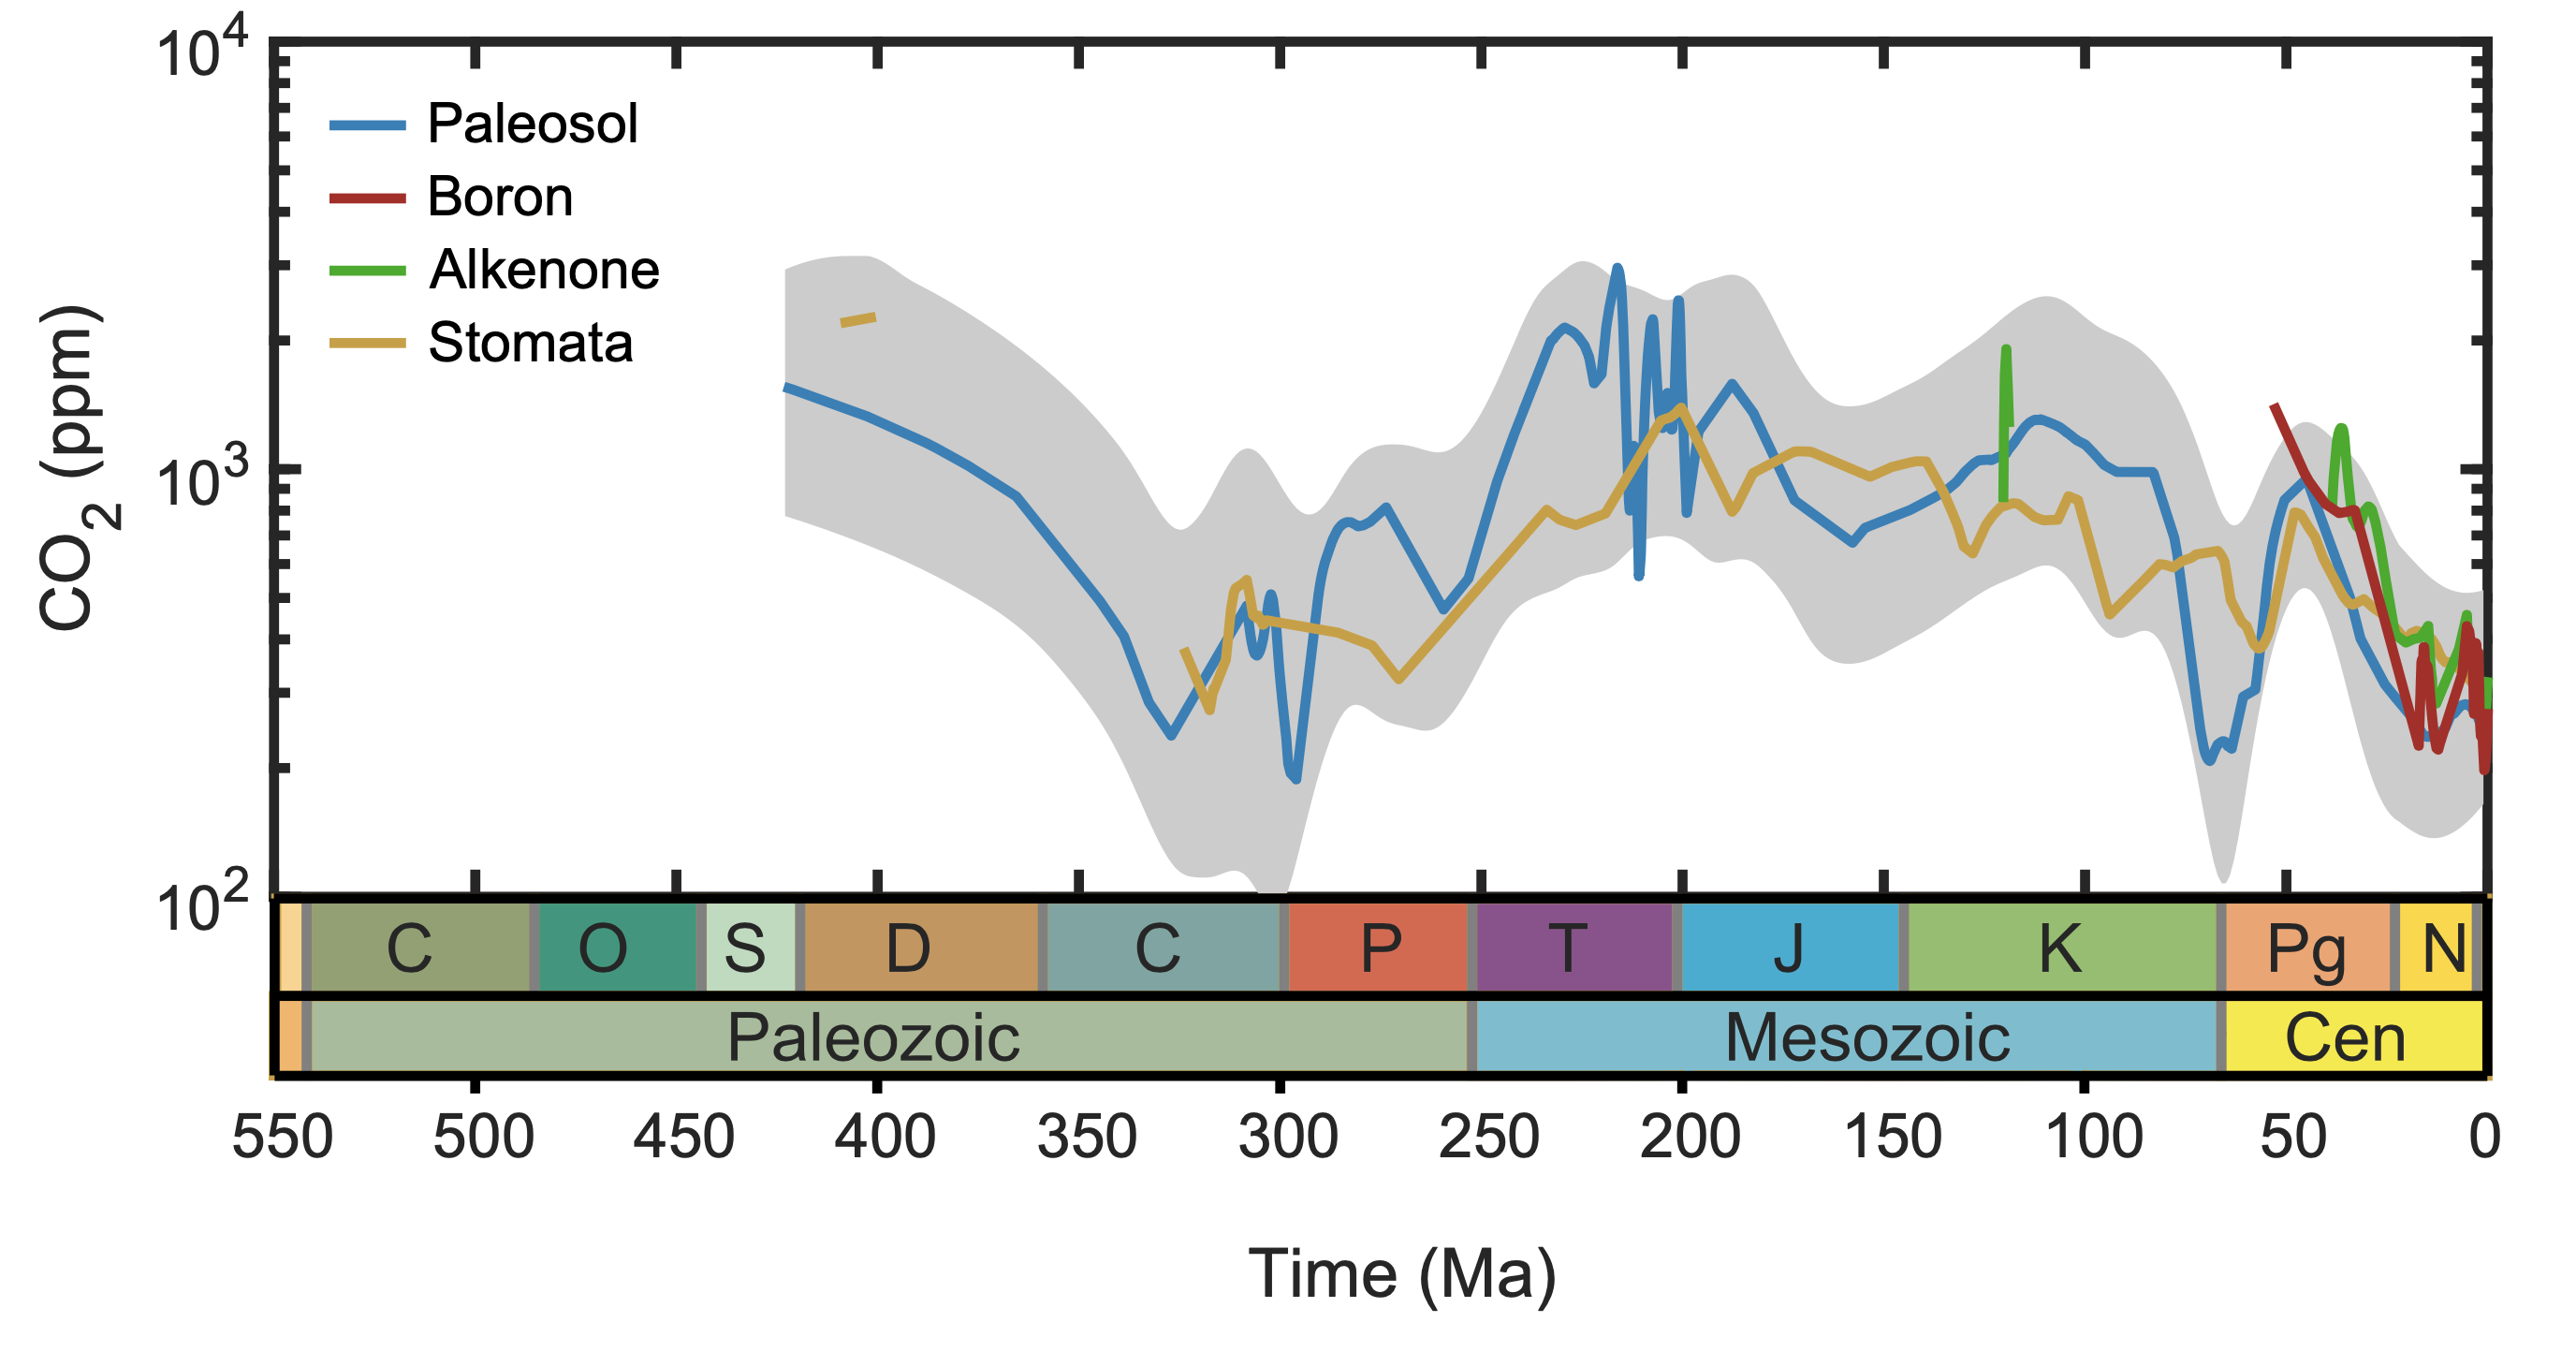
Figure 9— Estimates for atmospheric CO2 concentration (colored lines) during the last 420 millions years, based on different proxies. Average error shown as light grey bands. From Mills et al.[44]

Professor, Wesleyan University
The fact that CO2 levels have been higher in the past[45] should not be used as evidence that humans are not changing the climate or that we should not be concerned about our near future. Statements like the one above are common for climate skeptics, but they widely miss the mark for two main reasons:
If we continue on our current trajectory, global temperatures will soon reach levels not experienced since the time when ice sheets (like on Antarctica and Greenland) were absent. This was a “very” different Earth, and one humans have no experience living in.
The “rate” of climate change is faster than all documented climate change events in the geologic record. The fastest rates of change that we know about (in thousands of years) are associated with mass extinctions. Our current rate of change is hundreds of years. This is scary and does not bode well.
This review was updated in order to correct an error made in interpreting the Greenland Ice Sheet mass balance figure from Kjeldsen et al[1]. The Greenland Ice Sheet didn’t lose more mass during 2003-2010 than during all of 1900-2003 combined as previously written. Rather, the figure shows that the per year average ice loss during 2003-2010 is roughly 2.5 times higher than during 1900-2003.
REFERENCES:
- 1 – Kjeldsen et al. (2015) Spatial and temporal distribution of mass loss from the Greenland Ice Sheet since AD 1900. Nature.
- 2 – Frederikse et al. (2018) A Consistent Sea-Level Reconstruction and Its Budget on Basin and Global Scales over 1958–2014. Journal of Climate.
- 3 – Frederikse et al. (2020) The causes of sea-level rise since 1900. Nature.
- 4 – Dangendorf et al. (2019) Persistent acceleration in global sea-level rise since the 1960s. Nature Climate Change.
- 5 – Horton et al. (2018) Mapping Sea-Level Change in Time, Space, and Probability. Annual Review of Environment and Resources.
- 6 – IPCC (2014) Climate Change 2014: Summary for Policymakers. Contribution of Working Groups I, II and III to the Fifth Assessment Report of the Intergovernmental Panel on Climate Change.
- 7 – Ortiz-Bobea, et al. (2021) Anthropogenic climate change has slowed global agricultural productivity growth. Nature Climate Change.
- 8 – Doerr and Santín (2016) Global trends in wildfire and its impacts: perceptions versus realities in a changing world. Philosophical Transactions of the Royal Society B.
- 9 – Bowman et al. (2020) Vegetation fires in the Anthropocene. Nature Reviews Earth & Environment.
- 10 – Gonzalez et al. (2018) Chapter 25: Southwest. In Impacts, Risks, and Adaptation in the United States: Fourth National Climate Assessment, Volume II.
- 11 – Hausfather et al. (2020). Evaluating the performance of past climate model projections. Geophysical Research Letters.
- 12 – Mouginot and Rignot (2019). Forty-six years of Greenland Ice Sheet mass balance from 1972 to 2018. PNAS.
- 13 – Church and White (2011) Sea-Level Rise from the Late 19th to the Early 21st Century. Surveys in Geophysics.
- 14 – Jevrejeva et al.(2014) Trends and acceleration in global and regional sea levels since 1807. Global and Planetary Change.
- 15 – Ray and Douglas (2011) Experiments in reconstructing twentieth-century sea levels. Progress in Oceanography.
- 16 – Hay et al. (2015) Probabilistic reanalysis of twentieth-century sea-level rise. Nature.
- 17 – Dangendorf et al. (2019), Persistent acceleration in global sea-level rise since the 1960s. Nature Climate Change.
- 18 – Blunden and Arndt (2019). State of the Climate in 2018. Bulletin of the American Meteorology Society.
- 19 – Nerem et al. (2018) Climate-change–driven accelerated sea-level rise detected in the altimeter era. PNAS.
- 20 – Kopp et al. (2016) Temperature-driven global sea-level variability in the Common Era. PNAS.
- 21 – Walker et al. (2021) Common Era sea-level budgets along the U.S. Atlantic coast. Nature.
- 22 – Bamber et al. (2019) Ice sheet contributions to future sea-level rise from structured expert judgment. PNAS.
- 23 – Yang et al. (2014) Spatial and temporal patterns of global burned area in response to anthropogenic and environmental factors: Reconstructing global fire history for the 20th and early 21st centuries. Journal of Geophysical Research: Biogeosciences.
- 24 – Williams et al. (2019) Observed Impacts of Anthropogenic Climate Change on Wildfire in California. Earth’s Future.
- 25 – Abatzoglou and Williams (2016) Impact of anthropogenic climate change on wildfire across western US forests. PNAS.
- 26 – Goss et al. (2020) Climate change is increasing the likelihood of extreme autumn wildfire conditions across California. Environmental Research Letters.
- 27 – Abram et al. (2021) Connections of climate change and variability to large and extreme forest fires in southeast Australia. Communications Earth & Environment.
- 28 – Feurdean et al. (2020) Recent fire regime in the southern boreal forests of western Siberia is unprecedented in the last five millennia. Quaternary Science Reviews.
- 29 – Jones et al. (2020) Climate Change Increases the Risk of Wildfires. ScienceBrief Review.
- 30 – Gensini and Brooks (2018) Spatial trends in United States tornado frequency. npj Climate and Atmospheric Science.
- 31 – Elsner et al. (2018) Increasingly Powerful Tornadoes in the United States. Geophysical Research Letters.
- 32 – Diffenbaugh et al. (2013) Robust increases in severe thunderstorm environments in response to greenhouse forcing. PNAS.
- 33 – Hoogewind et al. (2017) The Impact of Climate Change on Hazardous Convective Weather in the United States: Insight from High-Resolution Dynamical Downscaling. Journal of Climate.
- 34- Brooks et al. (2014) Increased variability of tornado occurrence in the United States, Science.
- 35 – Marvel et al. (2019) Twentieth-century hydroclimate changes consistent with human influence. Nature.
- 36– Diffenbaugh et al. (2015) Anthropogenic warming has increased drought risk in California. PNAS.
- 37 – Williams et al. (2020) Large contribution from anthropogenic warming to an emerging North American megadrought. Science.
- 38 – Kossin et al. (2020) Global Increase in Major Tropical Cyclone Exceedance Probability over the Past Four Decades. Proceedings of the National Academy of Sciences.
- 39 – Liu et al. (2019) Causes of large projected increases in hurricane precipitation rates with global warming. npj Climate and Atmospheric Science.
- 40 – Knutson et al. (2020)Tropical Cyclones and Climate Change Assessment: Part II: Projected Response to Anthropogenic Warming. Bulletin of the American Meteorological Society.
- 41 – Hsiang et al. (2017) Estimating economic damage from climate change in the United States. Science.
- 42 – Lüthi et al. (2008). High-resolution carbon dioxide concentration record 650,000–800,000 years before present. Nature.
- 43 – Foster et al. (2017). Future climate forcing potentially without precedent in the last 420 million years. Nature Communications.
- 44 – Mills et al. (2019) Modelling the long-term carbon cycle, atmospheric CO2, and Earth surface temperature from late Neoproterozoic to present day. Gondwana Research.
- 45 – Siegert et al. (2020) What ancient climates tell us about high carbon dioxide concentrations in Earth’s atmosphere. Grantham Institute Briefing Note 13, Imperial College London.


