What our first measurement says about disinformation on major platforms in Europe
Science Feedback and partners have released a first measurement of Structural Indicators across six Very Large Online Platforms (VLOPs) in four EU member states (France, Spain, Poland, Slovakia). Below we highlight the headline results on (1) Prevalence of misinformation and (2) the “misinformation premium” (interaction advantage of low-credibility sources), with brief notes on (3) Monetisation and (4) Cross-platform aspects.
For methods, all figures, and country breakdowns, download the full report.
This report is published under the SIMODS project, which measures Structural Indicators of online mis/disinformation in Europe across major platforms. It is led by Science Feedback, in partnership with the Universitat Oberta de Catalunya, Check First, Newtral, Demagog SK, and Pravda.
Key findings at a glance
- Prevalence: TikTok shows the highest prevalence of misinformation aggregated across the four languages (~20% of exposure-weighted posts on public-interest topics), followed by Facebook (~13%) and X/Twitter (~11%). Instagram and YouTube are lower (~8%), and LinkedIn is lowest (~2%).
- Misinformation premium: Across most platforms, accounts that have repeatedly shared misinformation receive significantly more interactions per post per 1 000 followers than high-credibility accounts; LinkedIn is the main exception.
- Monetisation: Platform-level transparency remains insufficient to quantify payouts comparably across services; YouTube and Facebook allow partial inferences, while other platforms require DSA Article 40 access to close critical gaps.
- Cross-platform: Low-credibility actors maintain active presences across multiple services, with higher relative attraction to X/Twitter and Facebook; LinkedIn and Instagram are comparatively more favorable to high-credibility actors in our dataset.
Prevalence: how much misleading content do users encounter?
To approximate the content that users are actually exposed to on platforms, we estimated prevalence using exposure-weighted random samples of public-interest content and asked professional fact-checkers to determine the fraction of posts that contain misleading or false information.
The results show significant differences between platforms (Figure 1):
- TikTok exhibits the highest prevalence of mis/disinformation at approximately 20% [17.7%, 22.6%], indicating that roughly one in five posts on the platform regarding the topics we investigated contains misleading or false information.
- Facebook and X/Twitter follow with elevated prevalence at 13% [11.5%, 15.4%] and 11% [9.0%, 12.2%], respectively.
- YouTube and Instagram have a prevalence of about 8%.
- LinkedIn has the lowest prevalence of mis/disinformation at 2% [1.3%, 3.2%], suggesting that exposure to misinformation on this platform is limited.

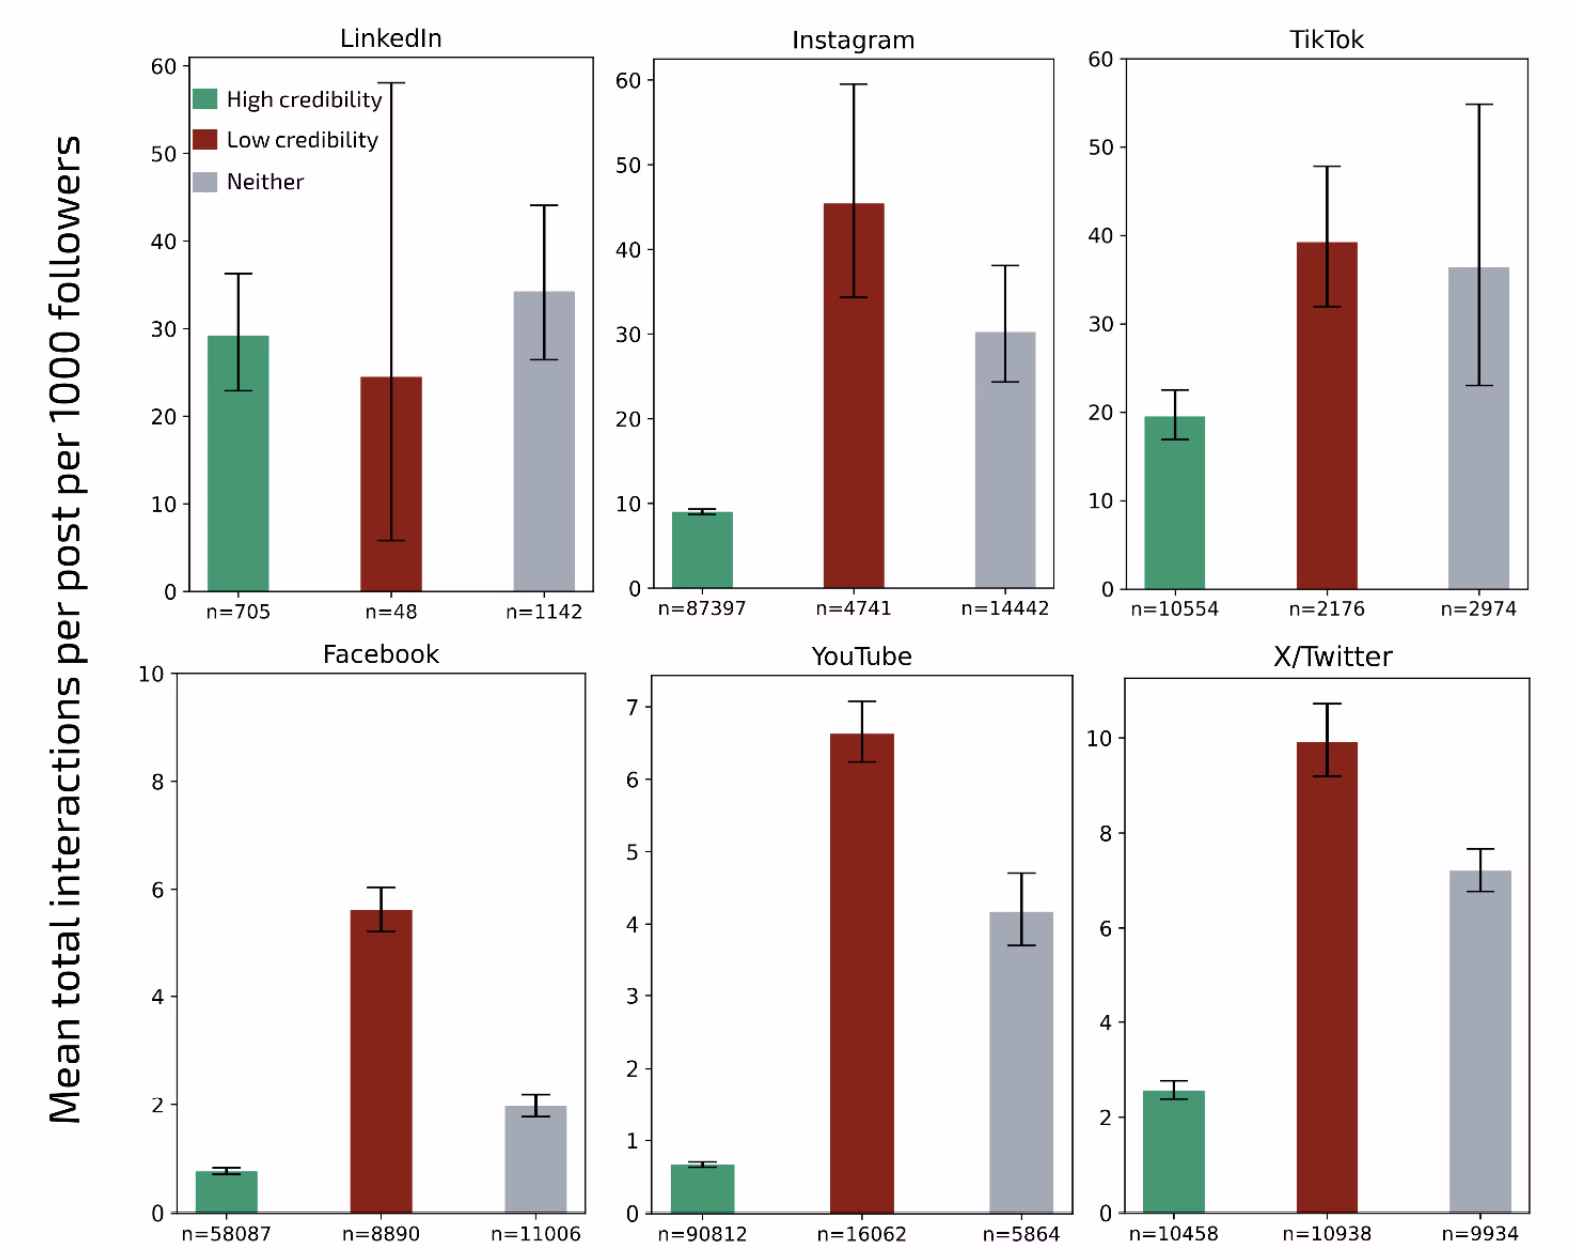
The “misinformation premium”: who gets more interactions for the audience they have?
To compare sources fairly, SIMODS focuses on interactions per post per 1 000 followers (reactions, comments, reshares). Across most platforms, low-credibility accounts enjoy a clear interaction advantage over high-credibility accounts; LinkedIn is the exception where differences are not statistically significant.
On YouTube low-credibility accounts get on average 8 times more interactions per post per 1 000 followers than high-credibility accounts. The ratio is ~7× on Facebook, around 5× on Instagram and X/Twitter, and about 2× on TikTok.
Monetization and Cross-platform presence
Monetization of mis/disinformation
Due to heterogeneous and limited public signals, comparable, account-level payout data are missing on most services. Indicative analyses show that low-credibility actors are largely monetized on YouTube and (to a narrower extent) on Facebook; elsewhere, public data are inadequate.
The report recommends using DSA Article 40 to obtain standardized, auditable monetization fields (eligibility, enrollment, content-level payout flags, account-level aggregates) in future cycles.
Cross-platform aspects
Low-credibility actors are more likely than high-credibility actors to be active on X/Twitter and Facebook; YouTube shows parity; Instagram and especially LinkedIn are comparatively less attractive to low-credibility actors.
Where they are present, low-credibility actors can cultivate sizeable audiences, most notably on YouTube (average followership ≈50% of high-credibility peers), with smaller relative audiences on Facebook, TikTok and X/Twitter, and the smallest on LinkedIn and Instagram.
Why this matters
LinkedIn’s comparatively low prevalence and lack of a misinformation premium demonstrate that product and policy choices matter: platforms can design systems that do not reward misleading content with additional visibility. Conversely, where a premium persists, repeat low-credibility sources can outsizedly influence discussions relative to their follower base. These are precisely the systemic risks the DSA seeks to address, and why Structural Indicators should be part of routine supervision and research access.
Read the full report
Measuring the State of Online Disinformation in Europe on Very Large Online Platforms First report of the SIMODS project (Structural Indicators to Monitor Online Disinformation Scientifically) (PDF)
Includes full methods, confidence intervals, country-level results, stratified robustness checks, and recommendations for policymakers and platforms.


