- Climate
How CO2 warms Earth through the greenhouse effect and why CO2 is not ‘saturated’ in Earth’s atmosphere

There is no doubt about it – climate science can be complex. But sometimes this complexity is mistaken for uncertainty. A recurring example is our scientific understanding of carbon dioxide’s (CO2) effects as a greenhouse gas[2]. However, the evidence for CO2 as a greenhouse gas is well-established and is built on a body of scientific evidence that started around 1856 and has been growing for over a century.
Given the complexity of this subject, pieces of the ‘puzzle’ are often taken out of context to support misleading and incorrect conclusions denying CO2’s influence on global temperatures. For example, on 24 April 2024, an article was posted on The Daily Sceptic claiming that CO2 emissions can’t warm the atmosphere because it is “saturated”. Given the recurring nature of this claim, below we will explain how CO2 functions as a greenhouse gas, then use scientific evidence to investigate recent claims about ‘CO2 saturation’.
A brief history of studying CO2 as a greenhouse gas
While remaining in the atmosphere, CO2 prevents heat from escaping and consequently warms the surface of Earth – a concept that is popularly known as the greenhouse effect (described in greater detail in the next section). Below we will highlight some key historical findings that laid the foundation for understanding CO2’s effects as a greenhouse gas. As you will see, this is not a new area of study, but rather a subject that has been studied and discussed for over 100 years. This distinction will be important later when investigating claims regarding ‘CO2 saturation’, which were addressed by scientists decades ago. Below is a timeline summarizing how scientists developed an understanding* of CO2’s properties and the greenhouse effect:
- 1760: The beginning of the industrial revolution. Atmospheric CO2 levels were around 280 parts per million (ppm)[1] – current levels are at 425 ppm as of May 2024.
- 1827: Fourier, French mathematician, determined that almost all heat lost from a planet is through infrared radiation (this was later important to our understanding of the greenhouse effect).
- 1856: Eunice Foote, American scientist, discovered that sunlight heats up air containing water vapor and CO2 (i.e., certain gases trap heat).
- 1859: John Tyndall, Irish physicist, discovered that CO2, water vapor, and ozone effectively trap heat even in relatively small quantities, while other atmospheric gases have little heat-trapping effect by comparison.
- 1896: Svante Arrhenius, Swedish scientist, quantified the warming from carbon dioxide’s greenhouse effect.
- 1938: Guy S. Callendar, English engineer, published a paper suggesting that human CO2 emissions were increasing temperatures on Earth.
- 1955: Gilbert Plass, Canadian physicist, calculated the effect of added CO2 on Earth’s radiation balance.
- 1958: Charles Keeling, American scientist, began collecting daily CO2 measurements in the air above Mauna Loa, Hawaii, and measurements have continued to the present day.
- 1967: Manabe and Wetherald calculated a predicted temperature rise based on a doubling of CO2 by creating one of the world’s first accurate computer models of Earth’s climate.
- 1990: Publication of the Intergovernmental Panel on Climate Change (IPCC) First Assessment Report with evidence linking rising CO2 levels to observed global temperature rise.
- 1990-2024**: A vast number of studies collected evidence linking rising CO2 to increasing global temperatures – including models with improved accuracy, paleoclimate studies, satellite data, and instrumental temperature records[2-7] (detailed in sections below).
*Please note that the older/foundational studies and papers do not represent the current state of climate science knowledge, but are listed above to show that some aspects of climate science have been long-established (e.g., the greenhouse effect).
**For the sake of brevity, we mainly listed earlier studies to demonstrate how long scientists have studied CO2 as a greenhouse gas. However, for clarity, we would like to note that the strongest scientific evidence has been found in the last few decades.
How rising atmospheric CO2 concentrations are increasing global temperatures through the greenhouse effect
To describe how atmospheric CO2 warms Earth, we will start at a zoomed out scale – looking at the Sun, Earth, and space – then zoom in to explain what’s happening on a molecular scale. Understanding what occurs at both scales helps paint a clearer picture of the greenhouse effect and CO2’s role therein.
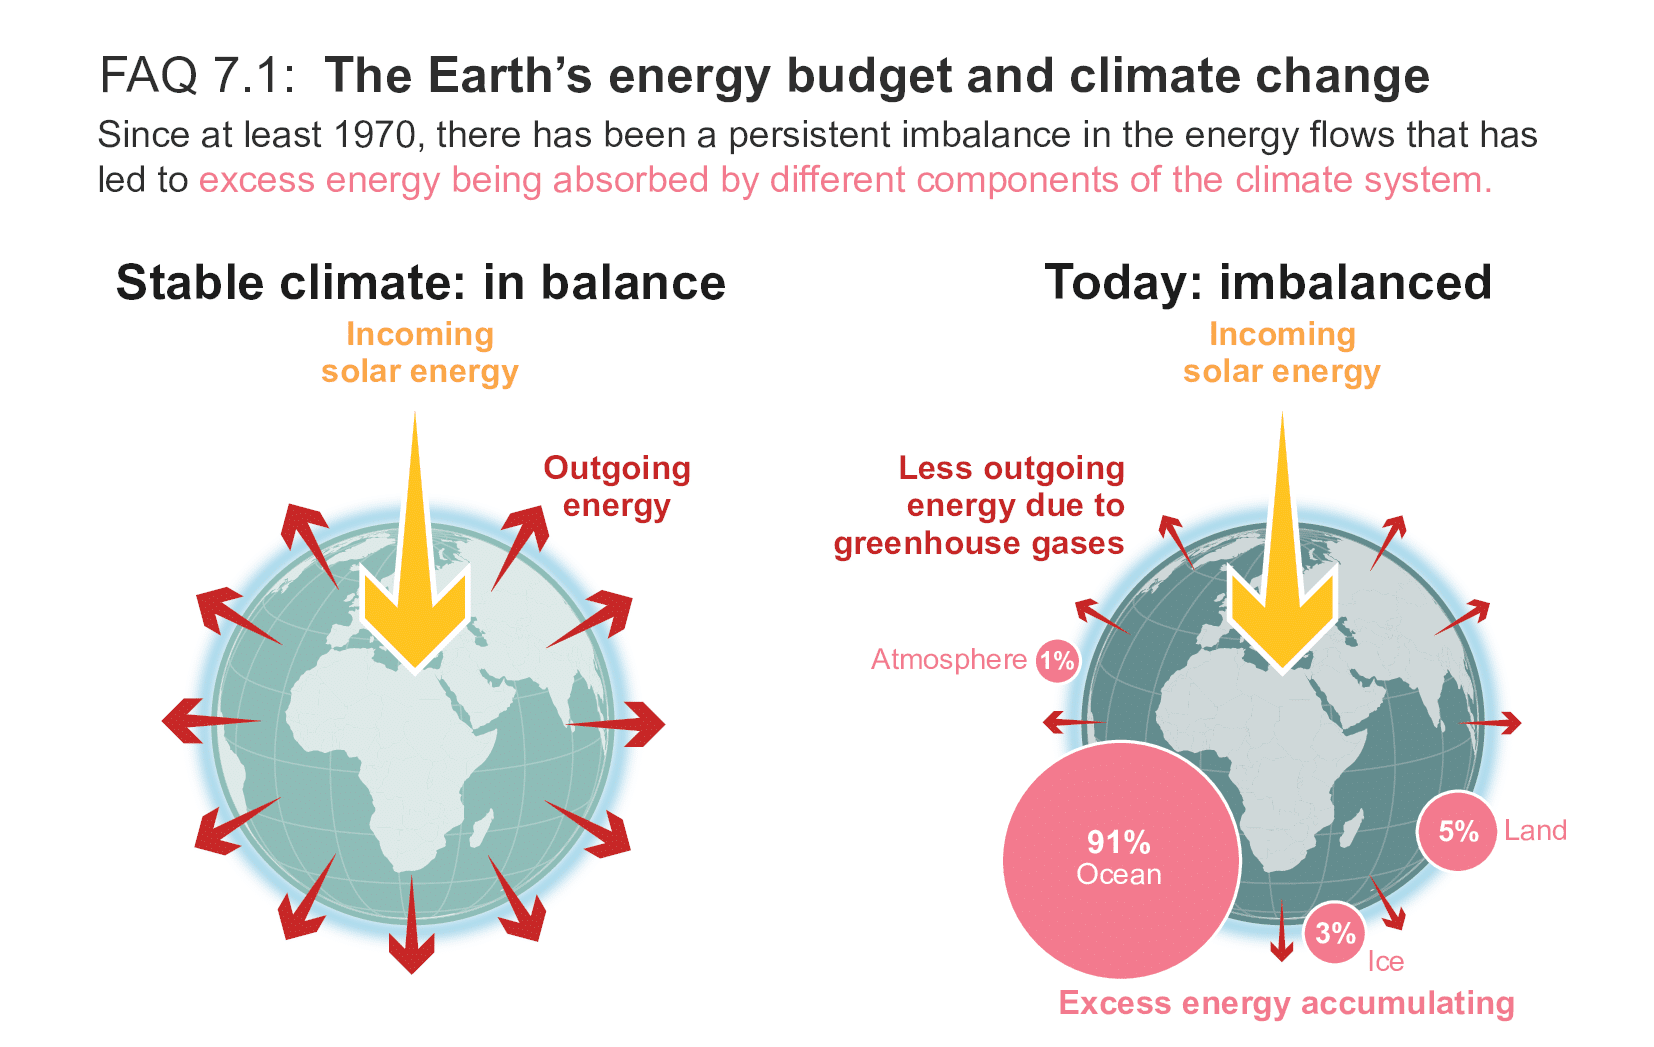
When we zoom out, we see that nearly all of Earth’s incoming energy comes from the Sun, and all of its lost energy goes back out to space. And it’s the balance between these gains and losses that changes Earth’s temperatures. When the amount of incoming solar energy is different from the amount going back out to space, our climate can be described as imbalanced; if incoming energy is greater, Earth warms, and if outgoing is greater, Earth cools. As this energy is trapped, it is also stored in different parts of Earth’s climate system including oceans, land, ice, and atmosphere. This energy balance is illustrated in Figure 1 below.
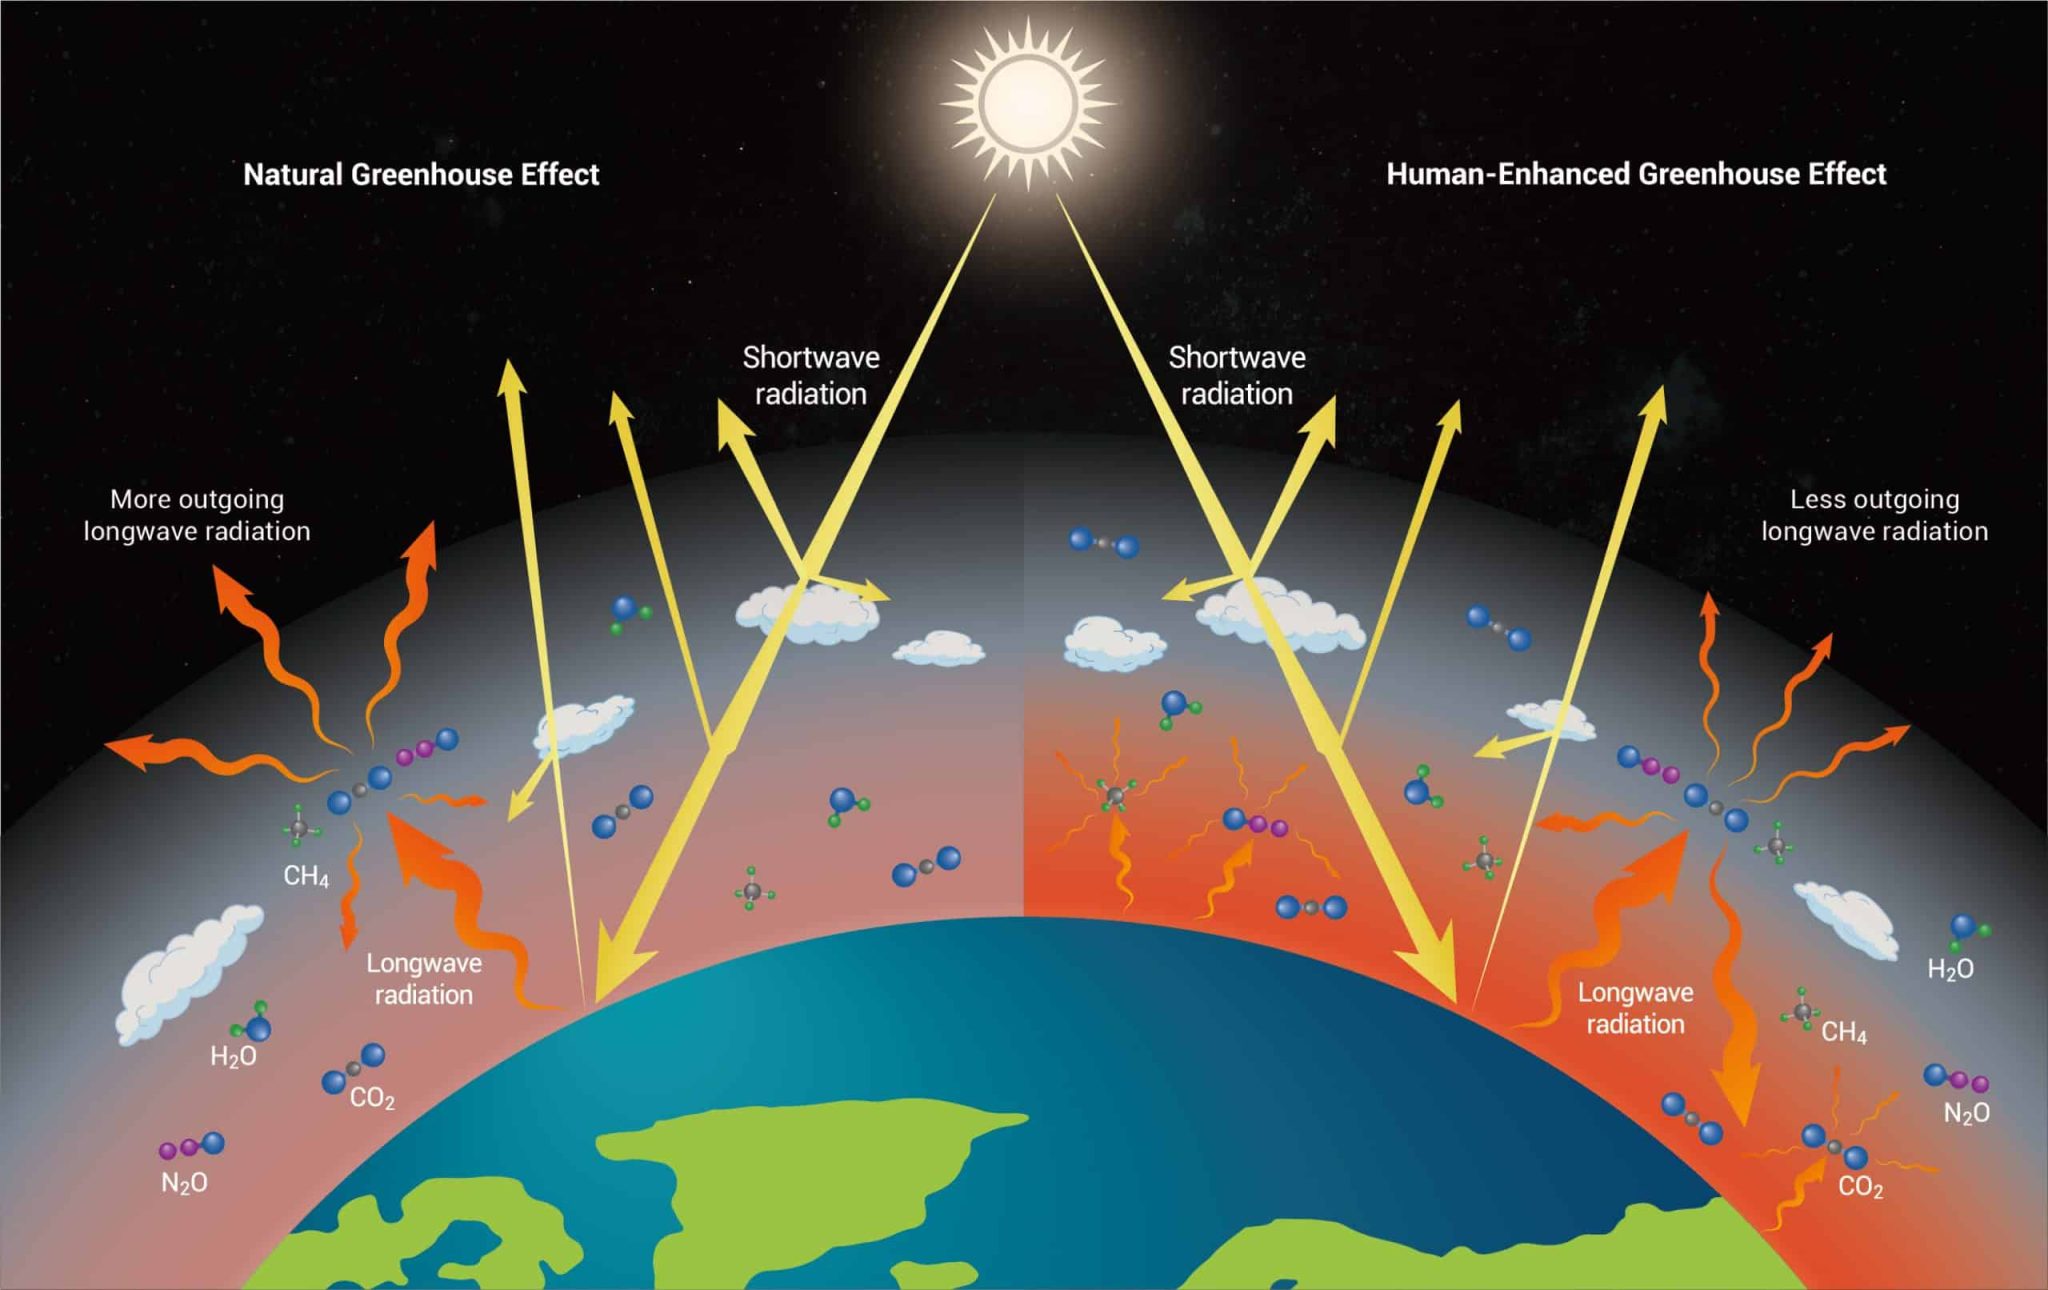
This explains how Earth warms, but now we must zoom in to the molecular scale to understand why this occurs. Afterall, given that the frigid vacuum of space is around -455° Farenheit (-270°C), why wouldn’t Earth quickly lose its incoming energy from the Sun? The key is the composition of our atmosphere – namely, the presence of greenhouse gases, such as CO2, which help trap heat. As explained in the timeline from our first section, the relationship between CO2 and global warming was discovered in the mid-19th century. Around that time, scientists discovered that certain molecules (greenhouse gases) absorb and re-emit infrared (IR) radiation (i.e., longwave radiation), while others allow it to pass right through – characteristics described as opaque and transparent, respectively[3,4]. This is important because, while these molecules do not absorb sunlight (shortwave radiation), Earth’s surface does. And in response, it emits IR radiation back towards the atmosphere where it is absorbed by CO2, then re-emitted in all directions, with some going back to Earth and some escaping to space[3]. The IR radiation that travels back to Earth’s surface raises its temperatures, while that which is lost to space lowers its temperatures – part of the energy balance mentioned earlier. Below are two figures showing this process at different scales. Figure 2 shows this process at a zoomed out scale (i.e., showing incoming and outgoing radiation), with yellow arrows representing solar radiation (shortwave) and orange arrows representing IR radiation (longwave). Note that the greenhouse gases act as barriers, intercepting and redistributing outgoing radiation as heat. Without greenhouse gases, IR radiation (heat) emitted from the Earth would simply escape to the cold vacuum of space. Figure 3 shows what is occurring at a molecular scale as greenhouse gases interact with IR radiation (shown as orange arrows in Figure 2).
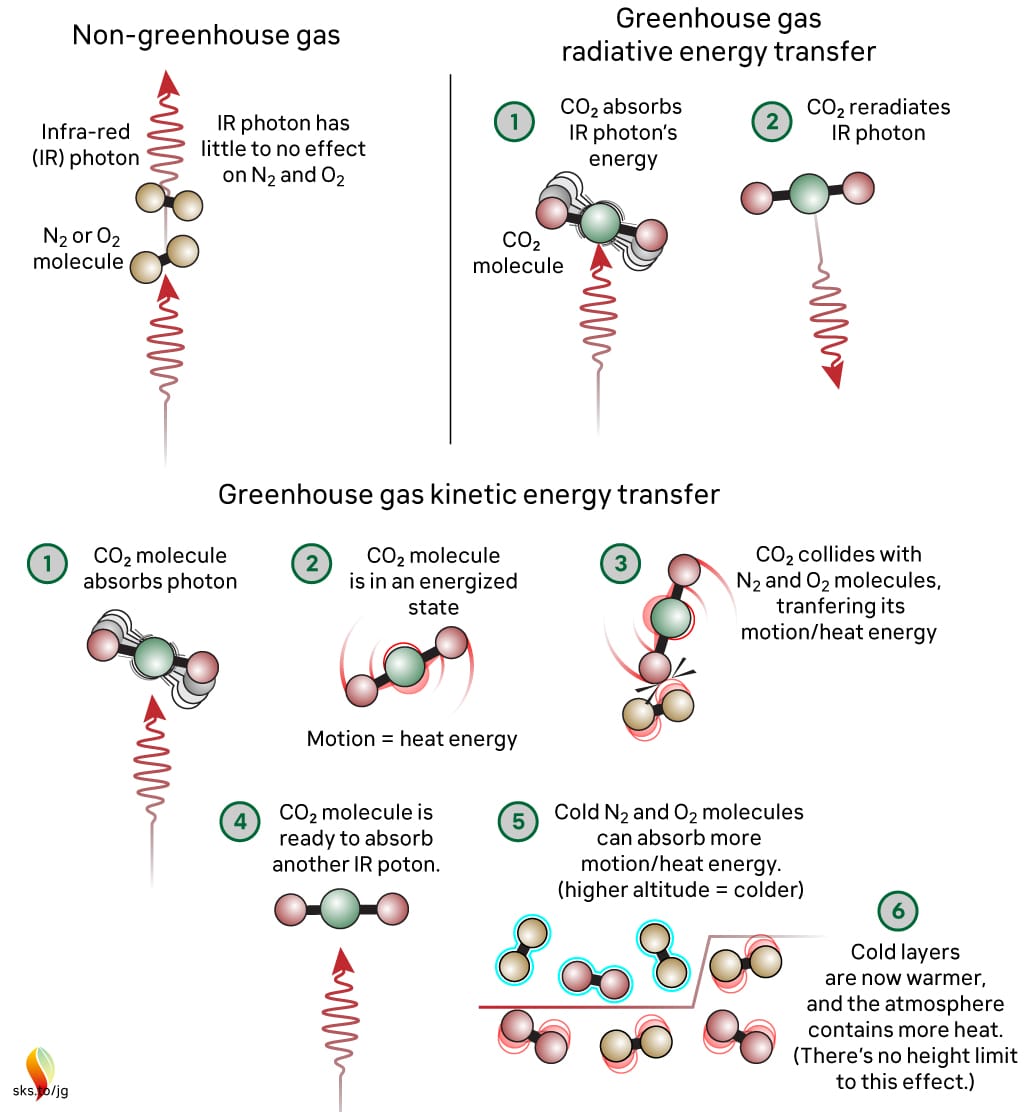
The interactions at a molecular scale are important because they explain why CO2 is able to drive global warming[2], despite being a lower percentage of Earth’s atmosphere than nitrogen (N2) and oxygen (O2), for example; CO2 absorbs and re-emits IR radiation, while N2 and O2 do not in Earth-like conditions[4] (Figure 3). Early experiments revealed this property of CO2 and the theory of the greenhouse effect, but it wasn’t until later that scientists found unequivocal evidence that rising CO2 is driving modern global warming. Much of this evidence was collected from 1990-2024, as noted by the placeholder from the timeline in our first section. Science Feedback has summarized some of this evidence in several past reviews, which are linked below:
- Review 1: Link between CO2 and Earth’s temperature is well-established, despite claims on Fox News
- Review 2: Video of Ian Plimer incorrectly states that human CO2 emissions are not responsible for increased atmospheric CO2 concentrations and global warming
- Review 3: CO2 caused warming during past climate changes, notably as a feedback amplifying other factors
The key takeaway from these past reviews is that scientists have found overwhelming evidence linking rising CO2 to increasing global temperatures in modern times. For example, scientists found that in modern times, greenhouse gases overall cause the most global warming of all the climate change drivers, and CO2 causes the most global warming of all the greenhouse gases (Figure 4).

Evidence also shows that global temperatures increase logarithmically as atmospheric CO2 concentrations rise, with a 20-year lag response[3,9](Figure 5).
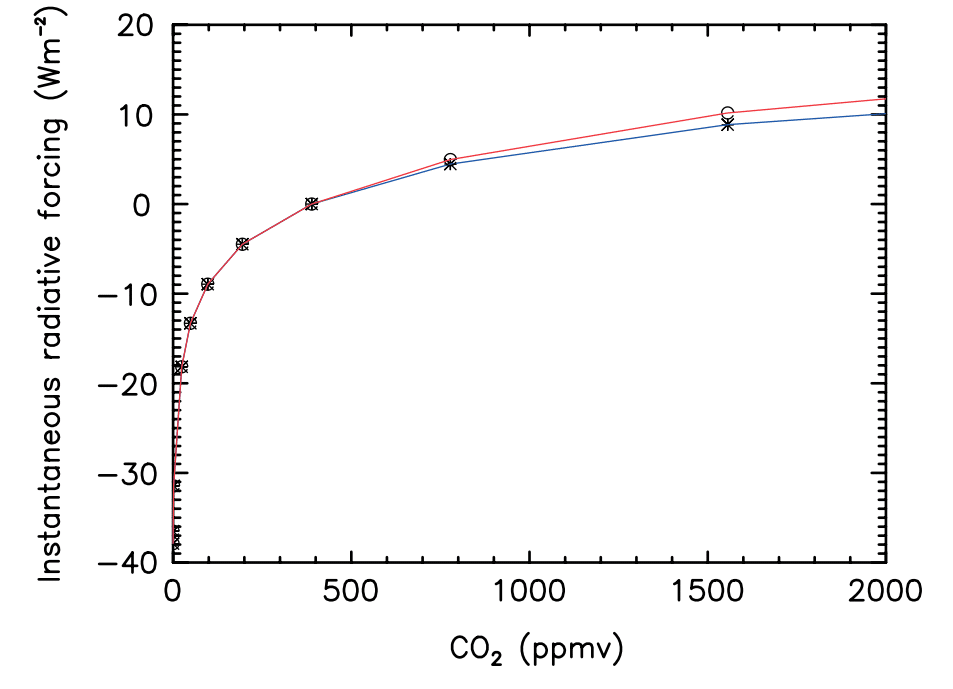
This finding is particularly important because it shows that although additional radiative forcing lessens gradually with increasing CO2 concentrations, it remains positive (i.e., temperature does not stop rising)[3]. This is clearly visible in Figure 5, where radiative forcing continues to rise with CO2 concentrations. It is worth noting that although the slope becomes more gradual, the resulting global warming is still predicted to have negative consequences for humans and ecosystems. As explained by the IPCC, “risks and projected adverse impacts and related losses and damages from climate change escalate with every increment of global warming.”[2] Zhong and Haigh (2013) concluded that as CO2 increases in the atmosphere, there is no saturation point at which it will no longer cause radiative forcing – therefore, it will continue to be a factor in global warming[3].
The vast body of evidence for CO2’s climate effects lead the IPCC, the world’s leading authority on climate science, to state that “the evidence is clear that carbon dioxide (CO2) is the main driver of climate change”. However, despite a vast body of evidence and overwhelming consensus among climate scientists[2,10], claims questioning CO2’s radiative forcing capabilities still arise. These claims often mischaracterize and oversimply more complex aspects of CO2 radiative forcing (e.g., physics of IR radiation absorption) to support their argument. For this reason, in the next section we will delve one layer deeper into radiative forcing to investigate these claims, and we will conclude with comments from climate science experts to offer additional insight.
Unequivocal evidence for radiative forcing from atmospheric CO2, driving global warming; no evidence showing that this effect is saturated
So far we have discussed the historical and scientific evidence of CO2’s effects as a greenhouse gas. Based on this information, the science behind the greenhouse effect – and CO2’s contribution to it – are well-established. But how do scientists know that radiative forcing from CO2 is ongoing, and has not reached an upper limit?
As previously mentioned, people continue to make claims questioning CO2’s ongoing capacity to function as a greenhouse gas – namely, that it can ‘no longer warm Earth’s atmosphere because CO2 is saturated’. However, this claim is far from being new. In fact, it originated in the early 20th century when the study of the greenhouse effect (prior to be coined as such) was in its infancy. From the timeline we shared earlier, you will recall that in 1896, Svante Arrhenius quantified the warming effect from increasing atmospheric CO2. In 1900, Knut Ångström, Swedish physicist, used experimental data – later found to be inaccurate[4] – to claim that CO2 is unable to affect Earth’s climate because of saturation of the center of the absorption band (around 15 nanometers) and overlap between the absorption bands of CO2 and water vapor. Despite being debunked decades ago (as will be explained below), people continue to share these claims. Below we will explain why these claims are incorrect based on available evidence.
The first recurring claim is that there is ‘saturation of the center of the absorption band for CO2, so it can no longer cause warming’. However, there are several issues with this claim that make it misleading and inaccurate, as detailed below. The first reason this is inaccurate can be explained by an excerpt from Zhong and Haigh (2013): “while the centre of the 15μm band becomes saturated, the band wings and, especially, the 10μm bands become dominant in determining the radiative effects – and these are nowhere near saturation”[3]. They further explain: “We conclude that as the concentration of CO2 in the Earth’s atmosphere continues to rise there will be no saturation in its absorption of radiation and thus there can be no complacency with regards to its potential to further warm the climate.”
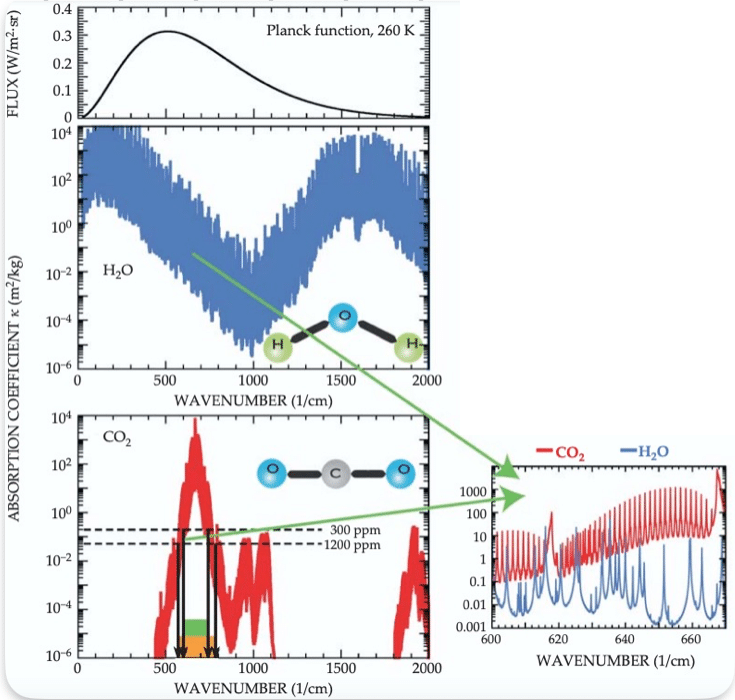
It’s worth taking a brief aside here to describe why greenhouse gas molecules absorb infrared radiation. Earlier, when we introduced the concept of greenhouse gases, we mentioned the terms opaque and transparent. Normally these words are used to describe materials that either allow light to pass through (transparent) or be blocked (opaque). This occurs because the material either absorbs the wavelengths of light or allows it to pass through. Absorption bands – mentioned in the claim and our cited quote above – refers to wavelengths at which a molecule absorbs radiation. Molecules can therefore be either transparent or opaque to certain wavelengths of radiation. In the case of CO2, for example, it is transparent to sunlight but opaque to IR radiation, thus absorbing and re-emitting it. And as explained in the quote from Zhong and Haigh (2013), there are still regions of the absorption bands where CO2 is opaque. They reference the 15μm band (which is the center band mentioned in the ‘saturation’ claim) and the 10μm bands which are “nowhere near saturation”. Other studies have shown similar findings. For example, Figure 6 below from Pierrehumbert (2011) shows the absorption bands for H2O and CO2, respectively, with regions that do not totally overlap. Note that current and projected atmospheric CO2 concentrations fall within the range (e.g., 300 ppm to 1200 ppm) where the ‘band wings’ become dominant in determining radiative forcing, as explained in the earlier quote by Zhong and Haigh (2013).
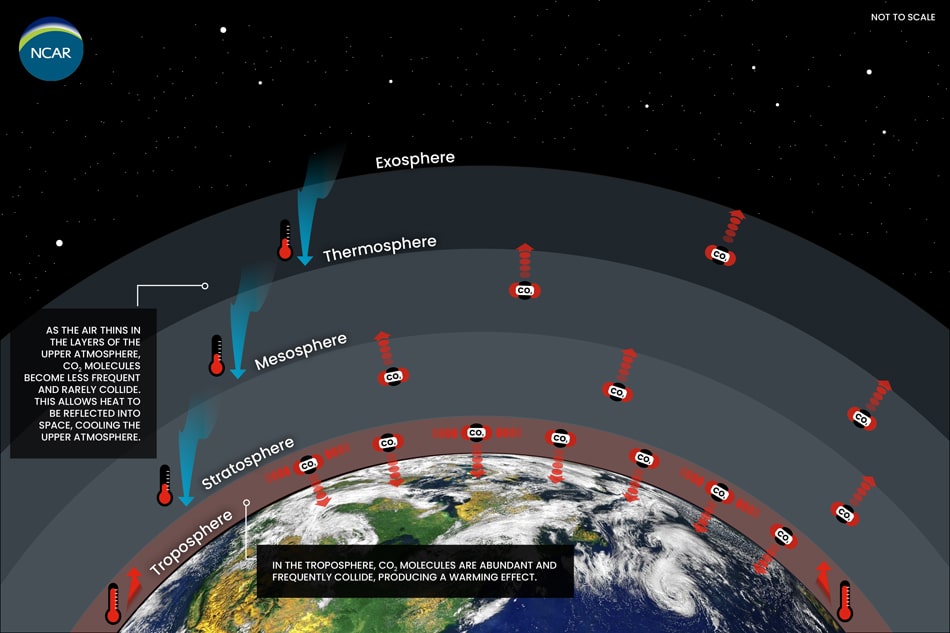
Claiming that ‘CO2 is saturated’ is also misleading due to its imprecision; it does not specify what altitude or region CO2 is becoming saturated, which treats the atmosphere as a single, homogeneous unit where all CO2 is saturated by IR radiation. But in reality, Earth’s atmosphere is stratified; different altitudes have different physical conditions (e.g., pressures, temperatures, and chemical compositions) (Figure 7). The type and amount of absorbed radiation can vary by altitude, and thus have different implications for global warming. For example, there is far more water vapor near Earth’s surface than in the upper atmosphere – where Earth’s heat is lost – and therefore lower competition between CO2 and H2O at higher altitudes[4].
This distinction is important to understand why the ‘CO2 saturation’ and the ‘competing H2O-CO2 absorption’ claims are incorrect. As explained in Pierrehumbert (2011):
“A related saturation fallacy, also popularized by Ångström, is that CO2 could have no influence on radiation balance because water vapor already absorbs all the IR that CO2 would absorb. Earth’s very moist, near-surface tropical atmosphere is nearly saturated in that sense, but the flaw in Ångström’s argument is that radiation in the portion of the spectrum affected by CO2 escapes to space from the cold, dry upper portions of the atmosphere, not from the warm, moist lower portions.”[4]
The paper also explains that the inset of Figure 6 above shows that:
“the individual water-vapor and CO2 spectral lines interleave but do not totally overlap. That structure limits the competition between CO2 and water vapor.”
As we’ve shown, climate scientists have found overwhelming evidence that CO2 raises global temperatures through radiative forcing. However, scientists long had trouble collecting one of the final pieces of evidence: high-quality, continuous satellite observations of outgoing IR radiation. But things changed in 2023 when a new study reported their findings after analyzing IR satellite measurements from 2003-2021. Raghuraman et al. (2023) explained that “these unprecedented observations provide measurements of Earth’s emitted thermal heat at fine-scale wavelengths, that is, the infrared spectrum, allowing us to pinpoint the effect of greenhouse gas concentration increases on Earth’s climate. We find large increases in the heat trapped by CO2, CH4, and N2O”[7]. Outgoing radiation is a critical part of the energy balance model we discussed earlier (i.e., incoming vs. outgoing energy). The benefit of collecting these data via satellite is that they show the final ‘signature’ of outgoing radiation – the end result of the complex radiative transfers occurring on Earth.
In summary, claims regarding CO2 saturation are nothing new, and proven to be inaccurate by several decades of scientific evidence. In recent times, new forms of scientific evidence, such as satellite observations of outgoing radiation[7], have only further shown that CO2 is not saturated and is still driving radiative forcing. Despite this, people still make these claims, as evidenced in The Daily Sceptic article posted on 24 April 2024. To supplement our investigation of general claims regarding CO2 saturation, we invited climate science experts to provide comments on The Daily Sceptic article and the following claims made within:
Claim 1: “Scientific evidence has emerged to suggest that the Earth’s atmosphere is ‘saturated’ with carbon dioxide, meaning that at higher levels the ‘greenhouse’ gas will not cause temperatures to rise” (referencing Kubicki et al. 2024)
Claim 2: “climate modellers and scientists in the anthropogenic camp are no nearer putting a temperature rise on a doubling of CO2 in the atmosphere. Estimates from 0.5°C up to around 6°C, with some outliers as high as 10°C, are little more than guesses”
Below is the feedback we received from climate science experts.
Scientists’ Feedback

Senior Lecturer, Imperial College London
The claims are completely unfounded. On the first point: there is scientific consensus that the Earth’s atmosphere is far from being saturated with CO2, in terms of its radiative impact. Hence as long as CO2 concentration increases, the greenhouse effect strengthens and thus global temperatures rise. Our best estimate is that global-mean temperature increases approximately linearly with cumulative CO2 emissions (see e.g. the IPCC 6th Assessment Report)[2], and logarithmically with CO2 concentration.
On the second point: our best estimate of the global-mean temperature change for a doubling of CO2 is 3°C (at equilibrium, so this is a long-term response), with a 90% range of 2-5°C. This is again summarised in the 6th Assessment Report of the IPCC, Working Group 1.[2]

Professor of Climate Sciences, Marine Chemistry and Geochemistry, Scripps Institution of Oceanography
The impact of CO2 on climate does not saturate in the way the Kubicki article implies. It’s true that CO2 becomes less potent as a greenhouse gas as levels continue to rise, due to an effect known as ‘band saturation’. But there is no hard stop, and this saturation effect, which is well understood, is built into our understanding of climate change.

Professor, University of Oxford
[In response to Ralph Keeling’s comment:] Yes, that’s right, and covers the situation up to any concentration of CO2 the Earth has had in the past three billion years or so. However, even after all bands are ‘saturated’ relative to transmission from the surface to space, adding more CO2 continues to provide warming, since adding more CO2 raises the altitude of the level from which radiation escapes to space, and it becomes colder relative to the ground temperature because of the temperature profile in optically thick atmospheres. That’s how Venus gets so hot. The whole ‘CO2 saturation’ myth is just obfuscation.

Emeritus Professor, Imperial College London
The main points made by Kubicki with respect to saturation of the CO2 15 micron band are correct – viz [namely] as the centre of the band saturates more absorption occurs in the wings. However, his analysis is oversimplistic. The variation of radiative forcing with increasing concentration is shown in the paper attached which takes account of spectrally resolved absorption right across a wide spectral range and concludes that the band is nowhere near saturated. See Figs 5&6 [from Zhong and Haigh (2013)].
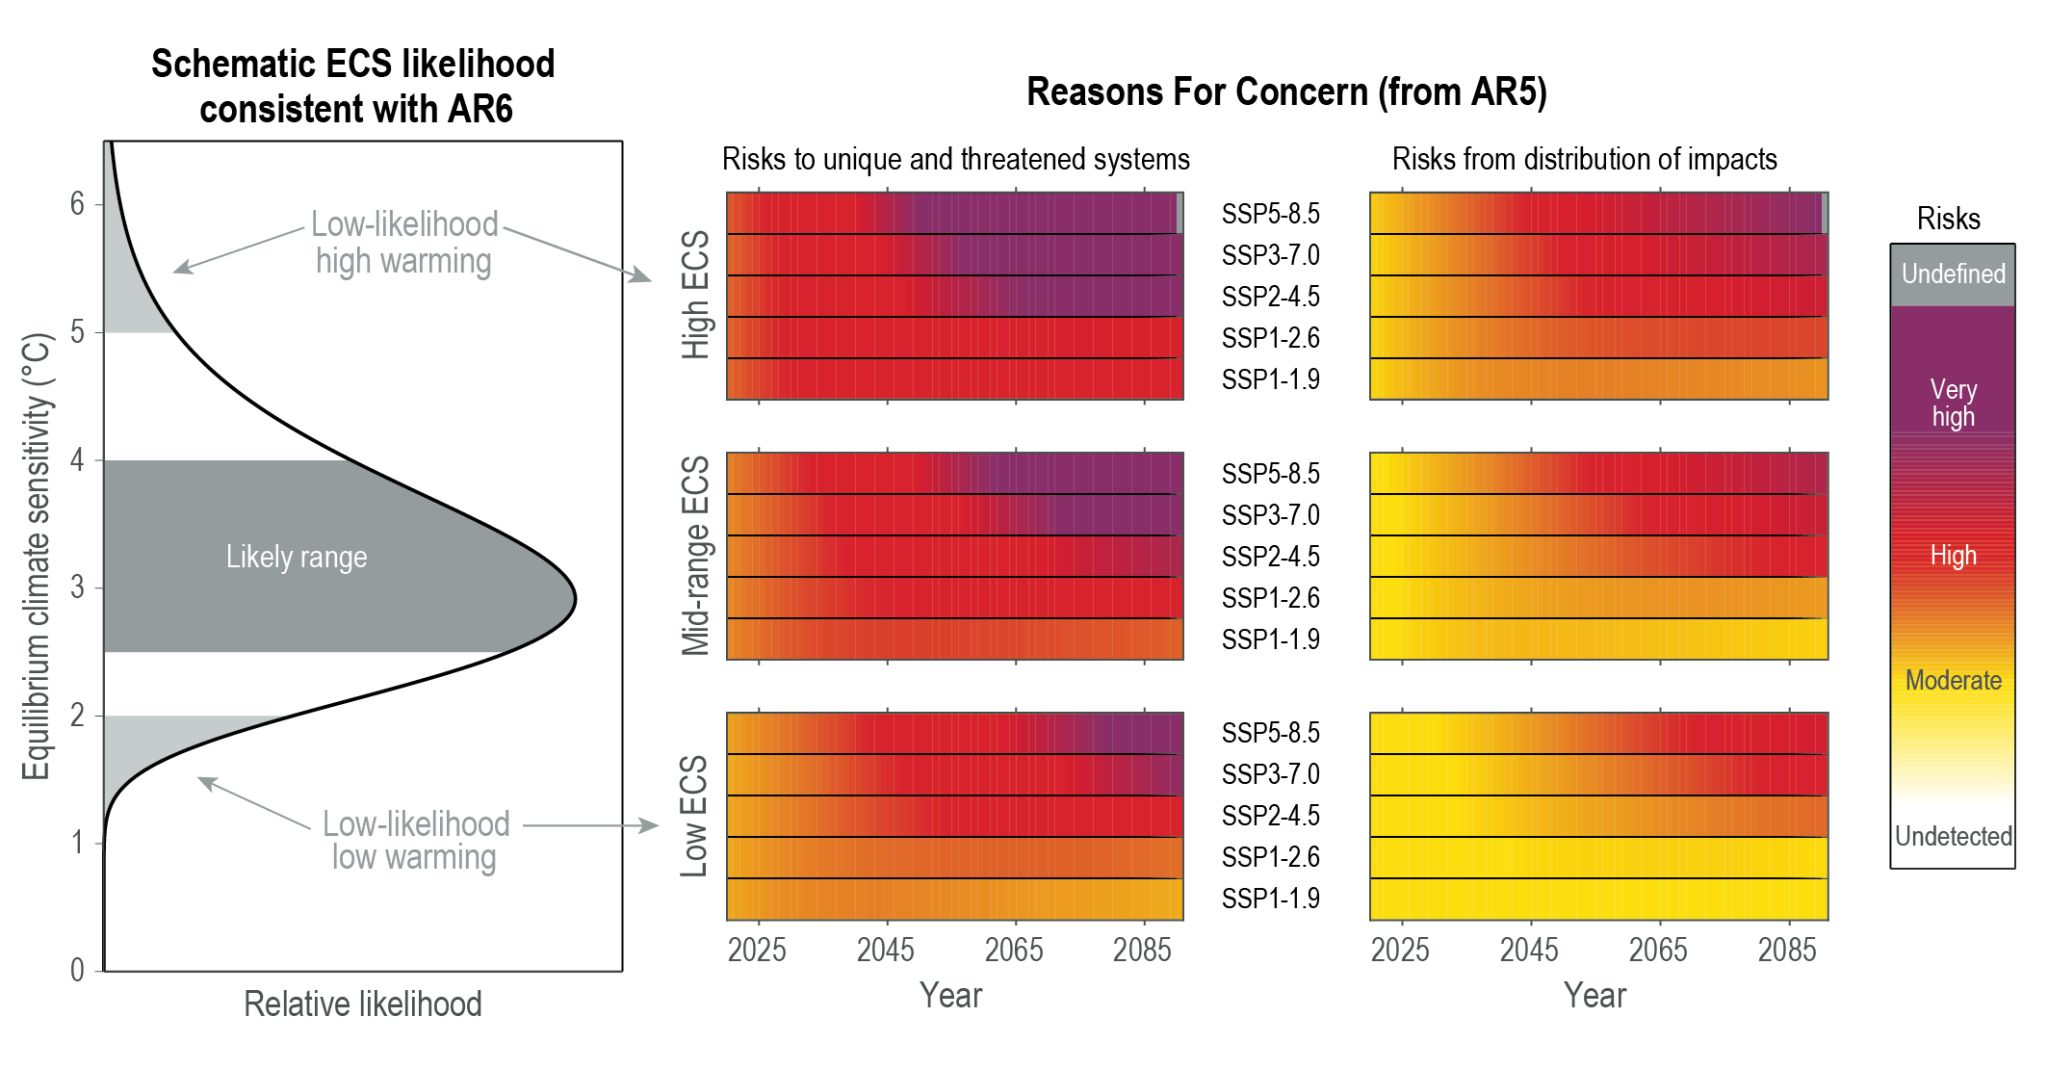
The current estimate for equilibrium climate sensitivity is “likely in the range 2.5°C to 4.0°C, and very likely between 2.0°C and 5.0°C” (IPCC AR6)[2]. The gratuitous statement that these are “little more than guesses” couldn’t be further from the truth. They are the result of extremely careful analysis of data from a range of sources including records of historical surface temperatures such as those deduced from ice cores over 100,000’s years and instrumental records since 1850. It is also estimated through computer model simulations ranging from simple energy balance models to more complex global climate models. The wide range results from uncertainties in details of how the climate modifies the impact, through, for example, changes in humidity, clouds and ice.

Research Scientist, British Antarctic Survey
Climate sensitivity (the temperature change associated with a doubling of atmospheric CO2) is a stubborn number to pin down. Estimates haven’t changed much in the decades since it was first introduced as a concept, and the most recent IPCC report pegs it at 2.5-4 C:
“equilibrium climate sensitivity (ECS) is likely in the range 2.5°C to 4.0°C, and very likely between 2.0°C and 5.0°C.”[2] (IPCC WG1 AR6 report, chapter 7. See also: Figure 1.16 AR6 WG1 Chapter 1).
This isn’t so very different from the range reported in the first real attempt to quantify it by Charney and colleagues in 1979: 1.5-4.5 C (Charney et al., 1979).
This is because of the complexity of the processes involved and the question marks that remain about important feedbacks in the climate system, especially relating to clouds and cloud feedbacks. We are still learning more about these feedbacks, and about how they may change. Numerous scientists have noted how difficult it is to narrow down the climate sensitivity (e.g. Sherwood et al., 2020; Sherwood & Forest, 2024)[12,13].
However, while scientists may disagree about exactly where in (or indeed above) this range the value of climate sensitivity lies, that doesn’t matter for refuting the central tenet of this article: that greenhouse gas emissions do not warm the atmosphere. This argument wilfully misunderstands the greenhouse effect.
Atmospheric greenhouse gases do not have a finite energy absorption capacity – rather, molecules of CO2 are constantly emitting and absorbing energy. Hence the idea that the atmosphere is ‘saturated’ with respect to CO2 is incorrect. There’s a much more eloquent rebuttal of this on skeptical science: https://skepticalscience.com/saturated-co2-effect.htm
More simply, climate sensitivity is positive, meaning that greenhouse gas emissions increase global average temperatures. This has been established using many lines of evidence, including historical observational data, proxies from much longer time periods (over tens or hundreds of thousands, or millions of years) and model simulations[13,2].
As an aside: one should also always be wary of climate science papers published in journals specialising in fields outside of climate science. For instance, the paper this claim hinges on is published in an engineering journal that has no reputation within the climate sciences. It’s highly unlikely this paper would have even made it past the editor of any well-regarded journal in the field.
REFERENCES:
- 1 – IPCC (2014). Fifth Assessment Report.
- 2 – IPCC (2021). Sixth Assessment Report.
- 3 – Zhong and Haigh (2013) The greenhouse effect and carbon dioxide. Royal Meteorological Society Weather.
- 4 – Pierrehumbert (2011) Infrared radiation and planetary temperature. Physics Today.
- 5 – Kaufman et al. (2020) Holocene global mean surface temperature, a multi-method reconstruction approach. Nature.
- 6 – PAGES 2K Consortium (2019) Consistent multidecadal variability in global temperature reconstructions and simulations over the Common Era. Nature Geoscience.
- 7 – Raghuraman et al. (2023) Greenhouse Gas Forcing and Climate Feedback Signatures Identified in Hyperspectral Infrared Satellite Observations. Geophysical Research Letters.
- 8 – Wang et al. (2023) Climate change: Strategies for mitigation and adaptation. The Innovation Geoscience.
- 9 – Huang and Shahabadi (2004) Why logarithmic? A note on the dependence of radiative forcing on gas concentration. Journal of Geophysical Research: Atmospheres.
- 10 – Anderegg et al. (2010) Expert credibility in climate change. Proceedings of the National Academy of Sciences.
- 12 – Sherwood et al. (2020) An Assessment of Earth’s Climate Sensitivity Using Multiple Lines of Evidence. Review of Geophysics.
- 13 – Sherwood and Forest (2024) Opinion: Can uncertainty in climate sensitivity be narrowed further?. European Geoscience Union.
Note: Scientists comments were lightly edited for clarity (i.e., information was added in brackets for context and minor punctuation changes were made).


